Monitoring Port Detail Information
You can monitor detailed port information for all ports at once or for individual ports using the Port Status menu.
Monitoring All Ports Status
To view all port status:
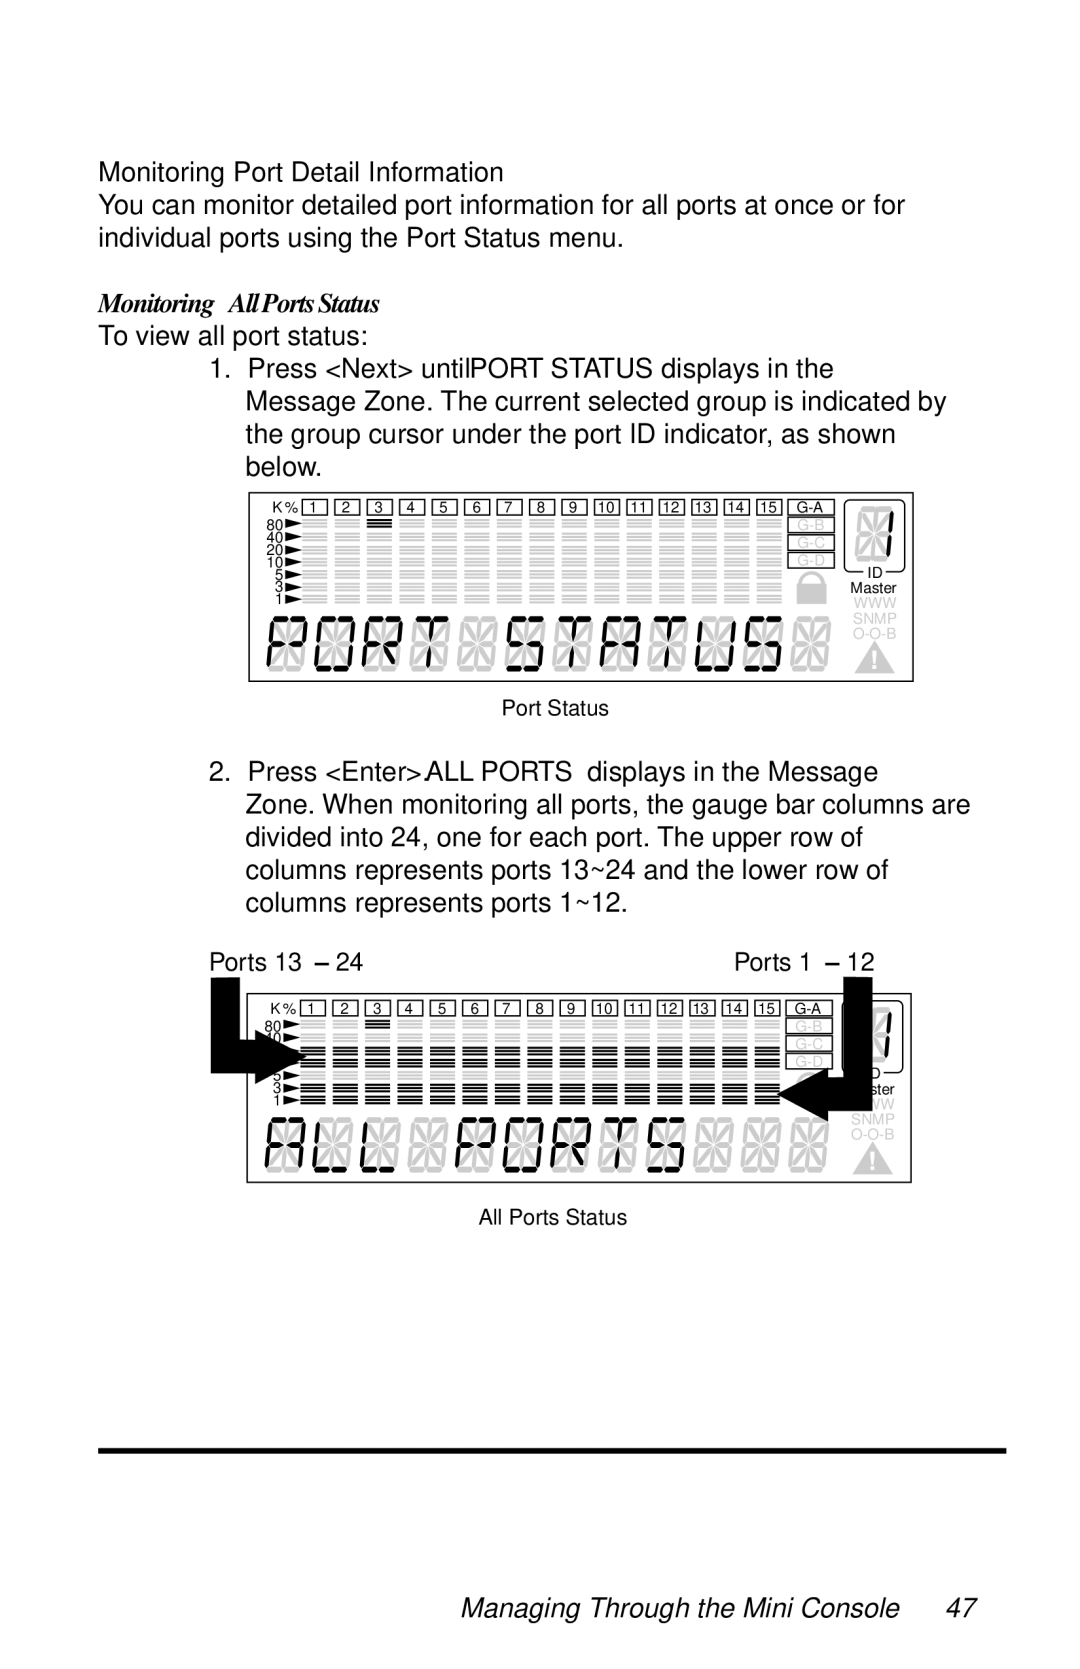
1.Press <Next> until “PORT STATUS” displays in the Message Zone. The current selected group is indicated by the group cursor under the port ID indicator, as shown below.
K % 1 2 3 4 5 6 7 8 9 10 11 12 13 14 15 | |
80 | |
40 | |
20 | |
10 | |
5 | ID |
3 | Master |
1 | WWW |
| SNMP |
| |
Port Status
2.Press <Enter>. “ALL PORTS” displays in the Message Zone. When monitoring all ports, the gauge bar columns are divided into 24, one for each port. The upper row of columns represents ports 13~24 and the lower row of columns represents ports 1~12.
Ports 13 – 24 | Ports 1 – 12 |
K % 1 2 3 4 5 6 7 8 9 10 11 12 13 14 15 | |
80 | |
| |
| |
3 |
|
1 |
|
| SNMP |
| |
All Ports Status