Viewing QTSS Service Statistics
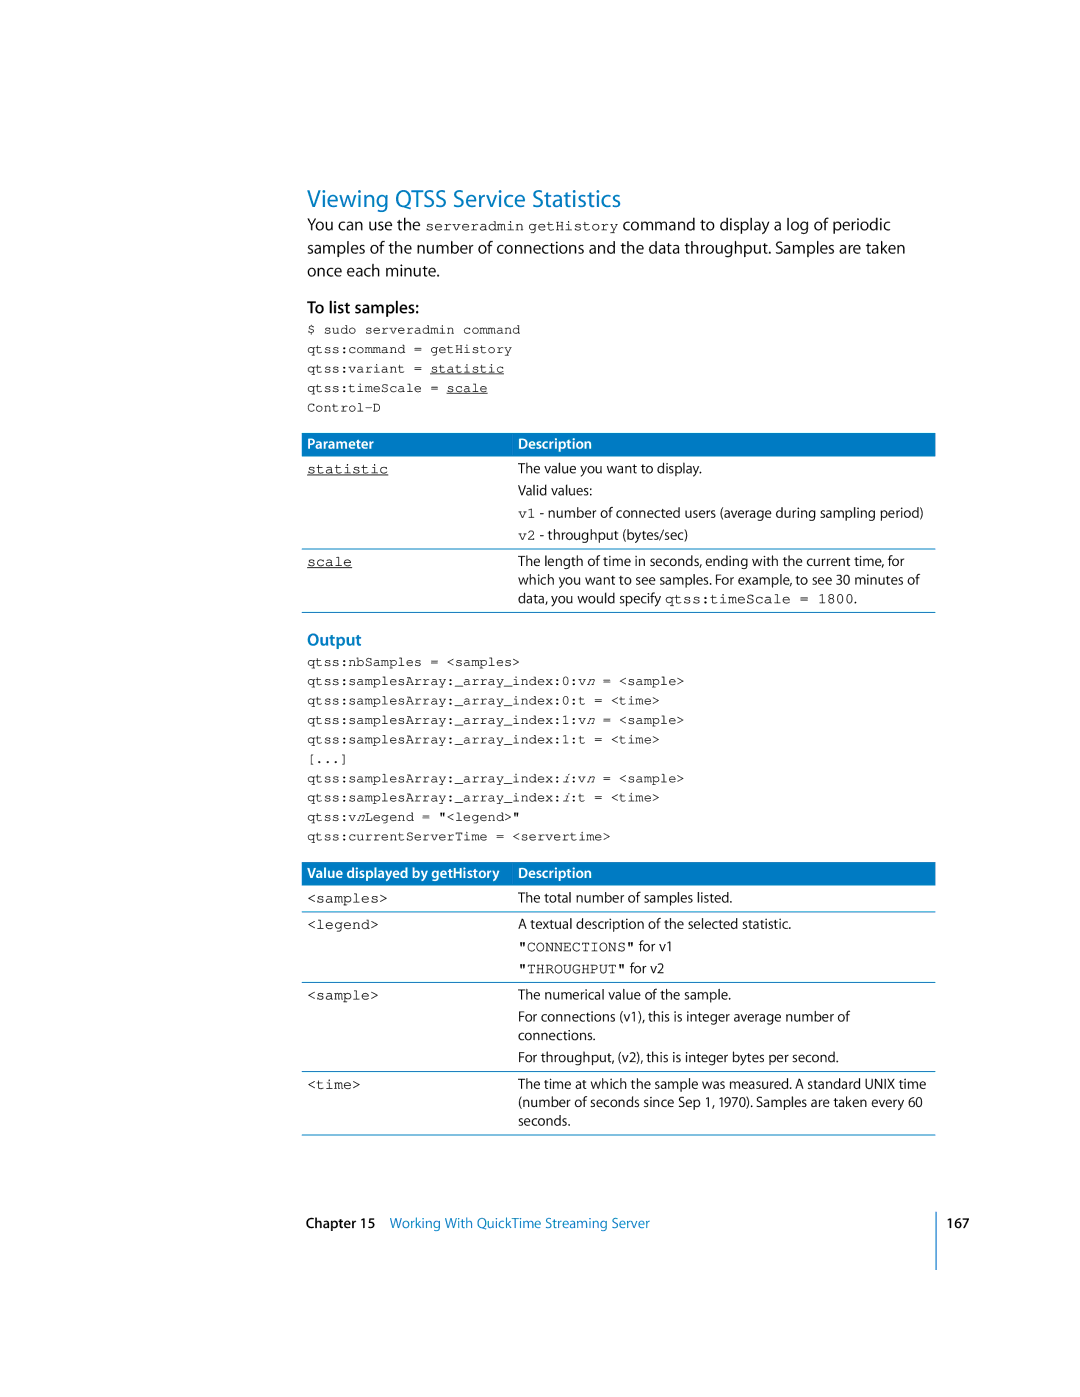
You can use the serveradmin getHistory command to display a log of periodic samples of the number of connections and the data throughput. Samples are taken once each minute.
To list samples:
$ sudo serveradmin command qtss:command = getHistory qtss:variant = statistic qtss:timeScale = scale
Parameter | Description | |
statistic | The value you want to display. | |
| Valid values: | |
| v1 | - number of connected users (average during sampling period) |
| v2 | - throughput (bytes/sec) |
|
| |
scale | The length of time in seconds, ending with the current time, for | |
| which you want to see samples. For example, to see 30 minutes of | |
| data, you would specify qtss:timeScale = 1800. | |
|
|
|
Output
qtss:nbSamples = <samples>
qtss:samplesArray:_array_index:0:vn = <sample>
qtss:samplesArray:_array_index:0:t = <time>
qtss:samplesArray:_array_index:1:vn = <sample>
qtss:samplesArray:_array_index:1:t = <time> [...] qtss:samplesArray:_array_index:i:vn = <sample> qtss:samplesArray:_array_index:i:t = <time> qtss:vnLegend = "<legend>" qtss:currentServerTime = <servertime>
Value displayed by getHistory | Description |
<samples> | The total number of samples listed. |
|
|
<legend> | A textual description of the selected statistic. |
| "CONNECTIONS" for v1 |
| "THROUGHPUT" for v2 |
|
|
<sample> | The numerical value of the sample. |
| For connections (v1), this is integer average number of |
| connections. |
| For throughput, (v2), this is integer bytes per second. |
|
|
<time> | The time at which the sample was measured. A standard UNIX time |
| (number of seconds since Sep 1, 1970). Samples are taken every 60 |
| seconds. |
|
|
Chapter 15 Working With QuickTime Streaming Server
167
