DGS-3024 Gigabit Ethernet Switch Manual
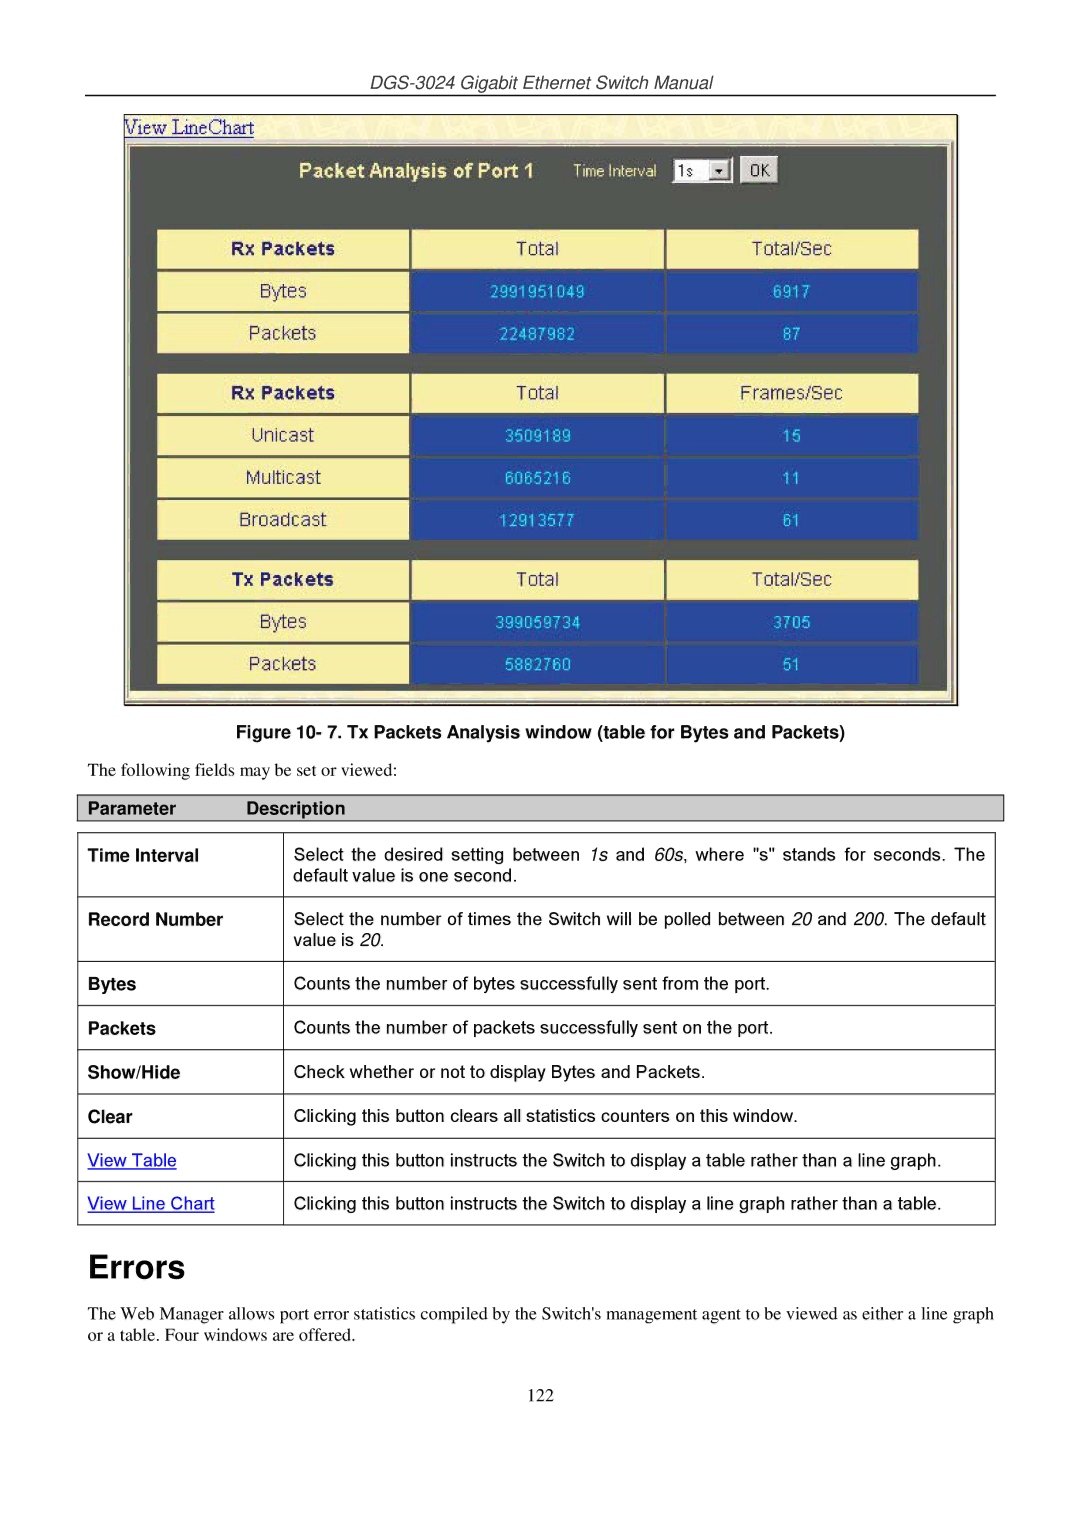
Figure 10- 7. Tx Packets Analysis window (table for Bytes and Packets)
The following fields may be set or viewed:
Parameter | Description | ||
|
|
|
|
Time Interval |
| Select the desired setting between 1s and 60s, where "s" stands for seconds. The |
|
|
| default value is one second. |
|
|
|
|
|
Record Number |
| Select the number of times the Switch will be polled between 20 and 200. The default |
|
|
| value is 20. |
|
|
|
|
|
Bytes |
| Counts the number of bytes successfully sent from the port. |
|
|
|
|
|
Packets |
| Counts the number of packets successfully sent on the port. |
|
|
|
|
|
Show/Hide |
| Check whether or not to display Bytes and Packets. |
|
|
|
|
|
Clear |
| Clicking this button clears all statistics counters on this window. |
|
|
|
|
|
View Table |
| Clicking this button instructs the Switch to display a table rather than a line graph. |
|
|
|
|
|
View Line Chart |
| Clicking this button instructs the Switch to display a line graph rather than a table. |
|
|
|
|
|
Errors
The Web Manager allows port error statistics compiled by the Switch's management agent to be viewed as either a line graph or a table. Four windows are offered.
122