Intermodule Measurements
To view trace lists and waveforms together on the same display
You can use the Mixed Display feature in the state analyzer menus to show both waveforms and trace lists in the same display, making it easier to correlate the events of interest.
If you are using mixed display as part of a group run, you may need to adjust intermodule skew to ensure proper time correlation and display results.
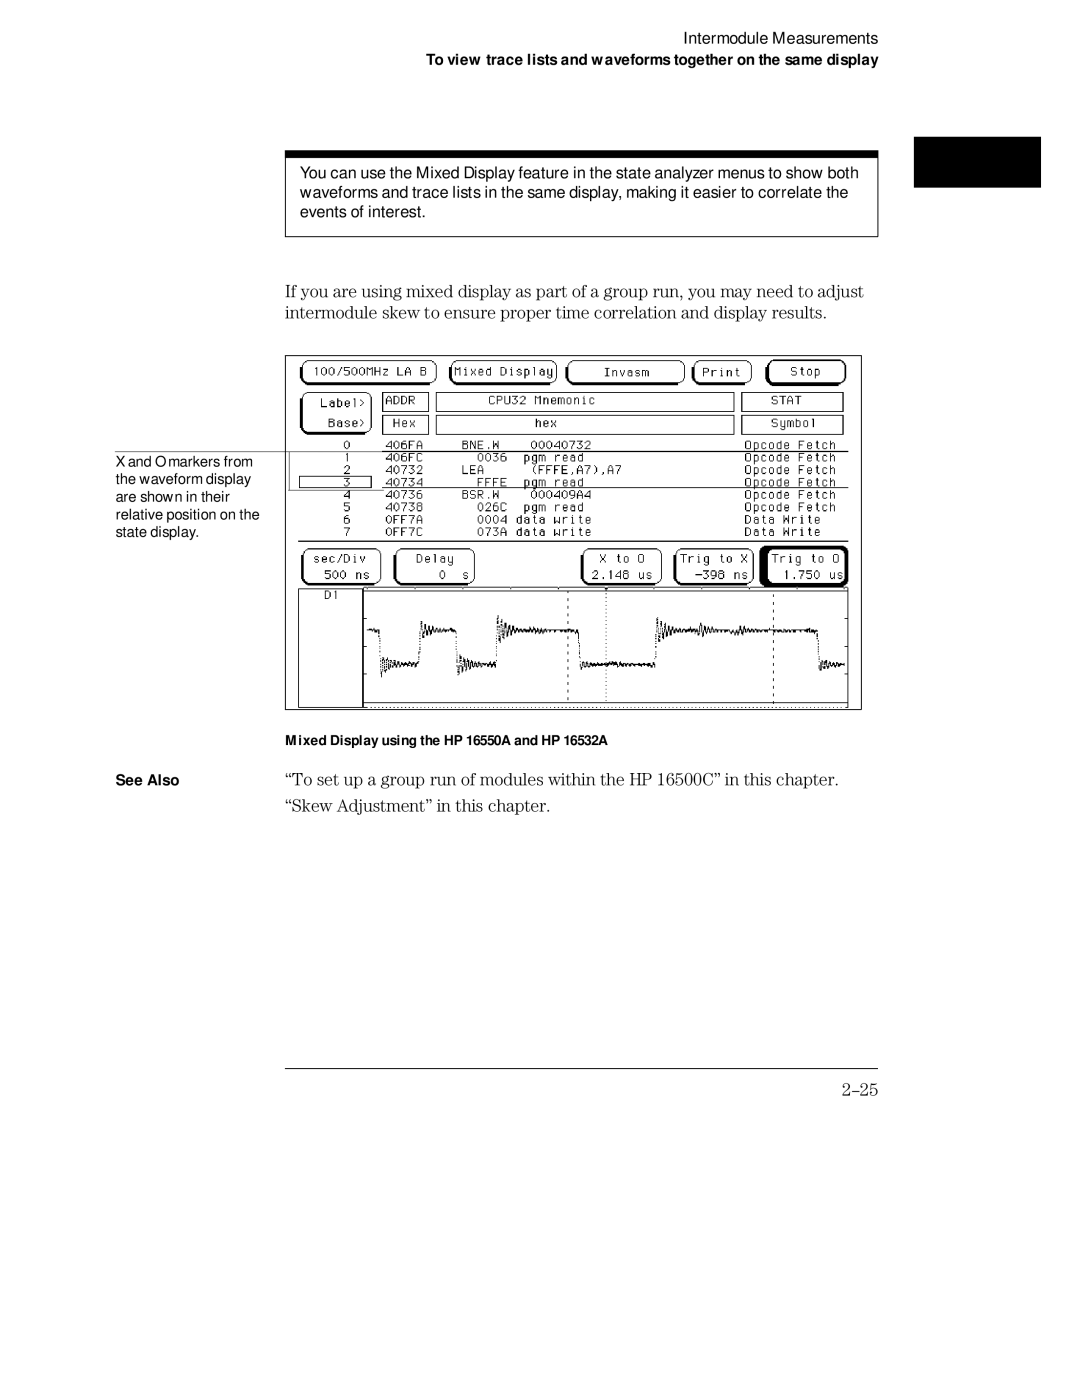
X and O markers from the waveform display are shown in their relative position on the state display.
| Mixed Display using the HP 16550A and HP 16532A |
See Also | “To set up a group run of modules within the HP 16500C” in this chapter. |
| “Skew Adjustment” in this chapter. |