3.the standard deviation assuming the data set represents the entire population, σ x;
4.the sum of the data values, ∑ x;
5.the sum of the squared data values, ∑ x2;
6.the number of values in the data set, n;
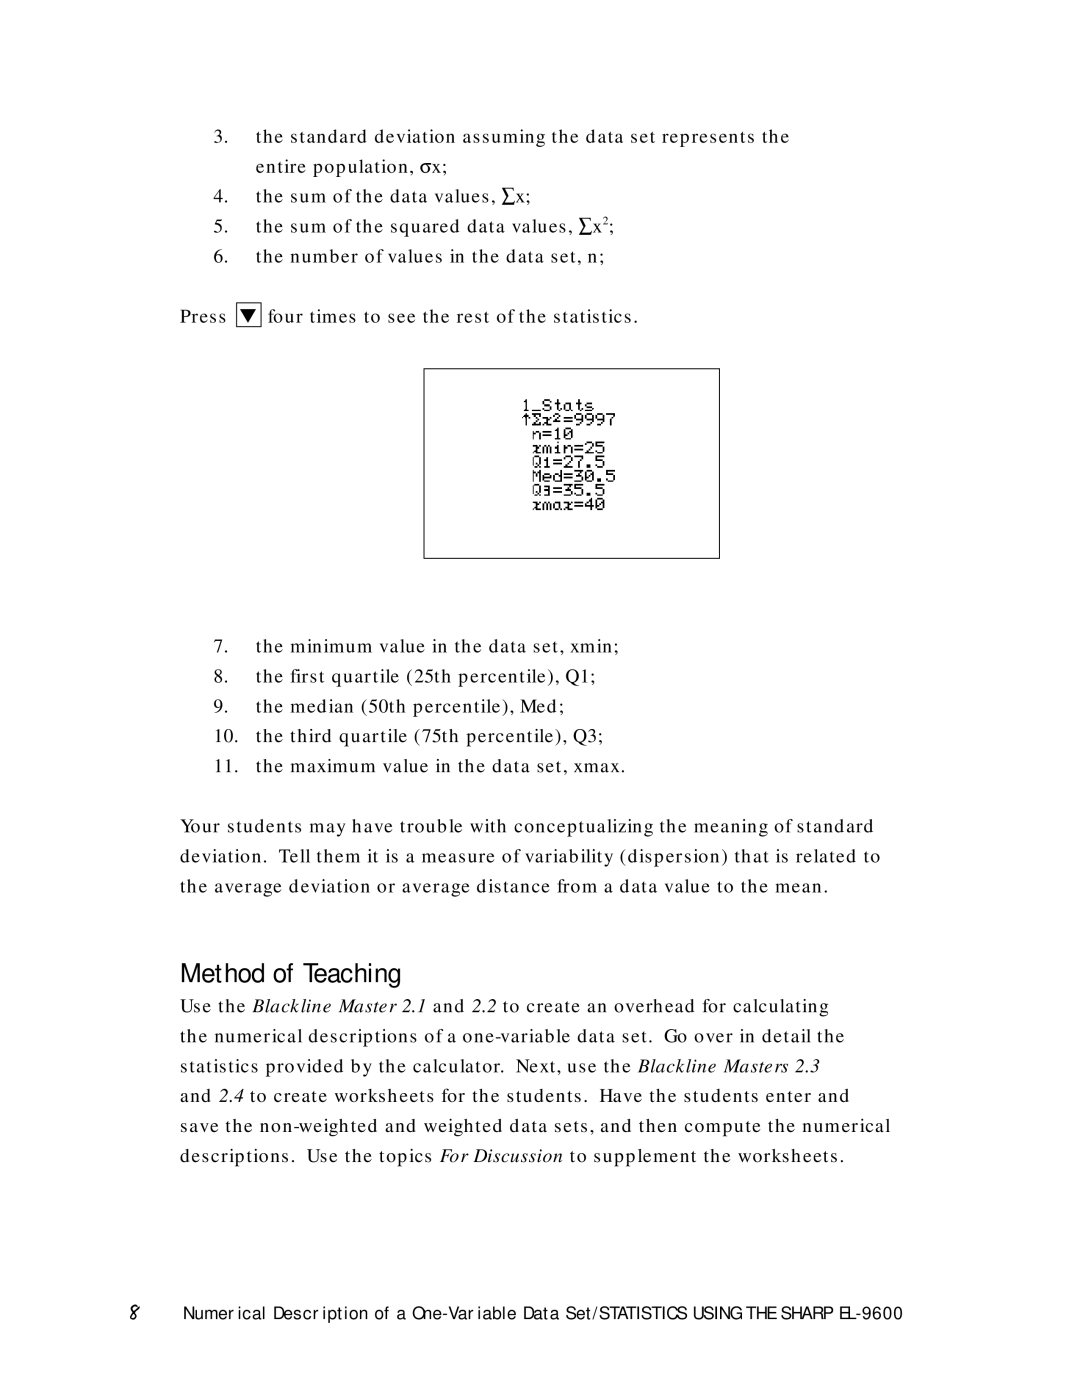
Press
▼
four times to see the rest of the statistics.
7.the minimum value in the data set, xmin;
8.the first quartile (25th percentile), Q1;
9.the median (50th percentile), Med;
10.the third quartile (75th percentile), Q3;
11.the maximum value in the data set, xmax.
Your students may have trouble with conceptualizing the meaning of standard deviation. Tell them it is a measure of variability (dispersion) that is related to the average deviation or average distance from a data value to the mean.
Method of Teaching
Use the Blackline Master 2.1 and 2.2 to create an overhead for calculating the numerical descriptions of a
8Numerical Description of a
