Additional Problems
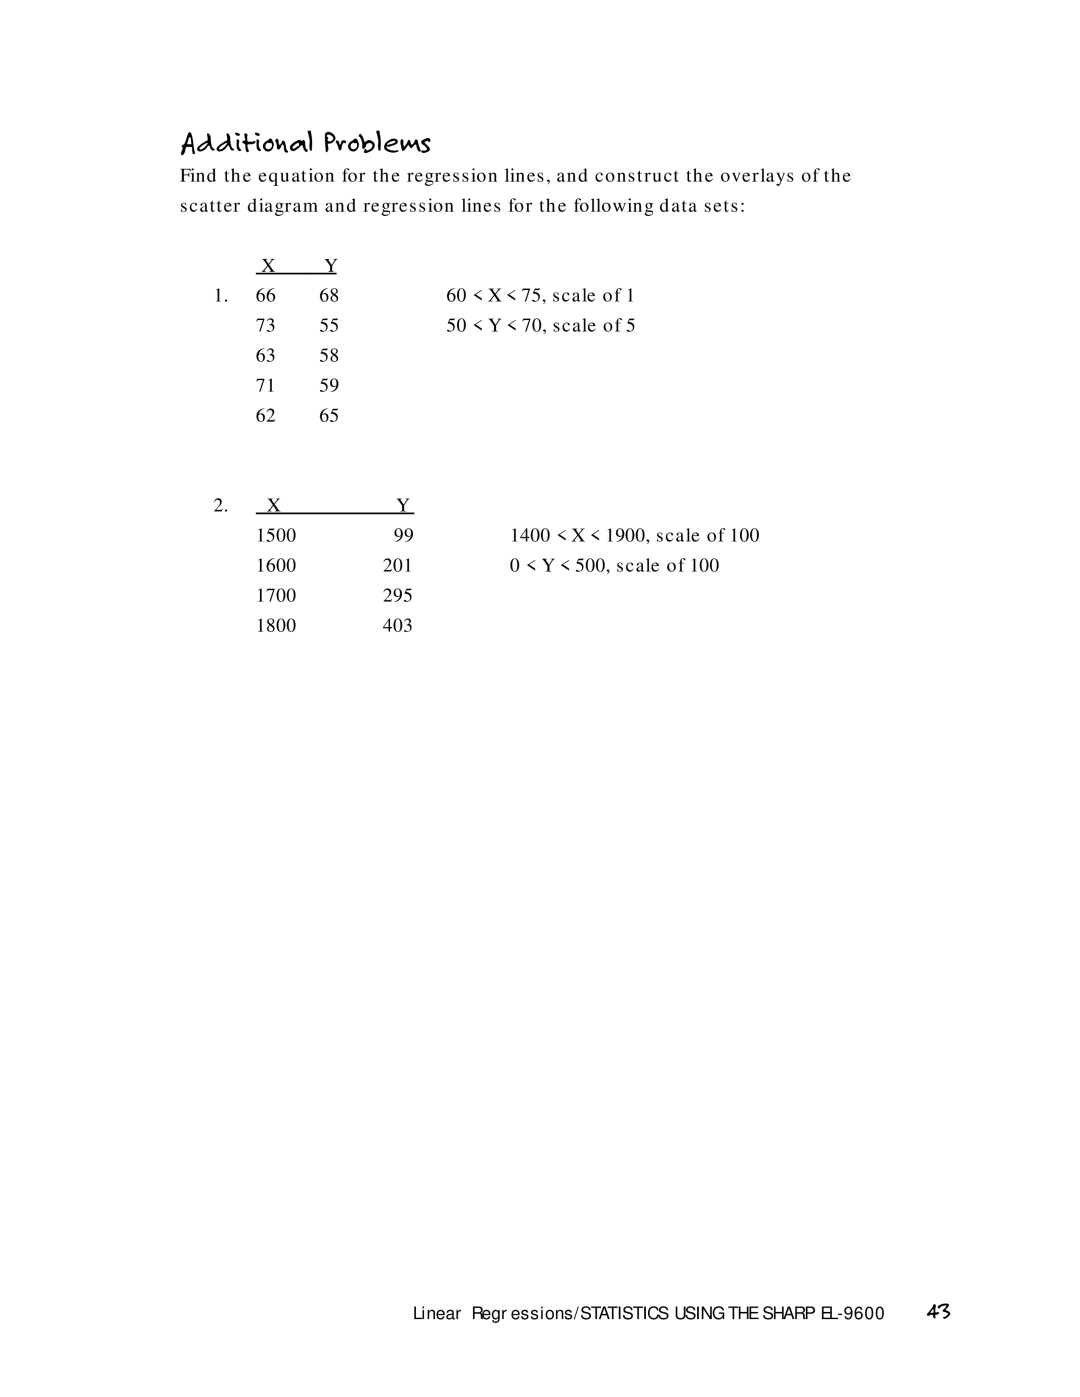
Find the equation for the regression lines, and construct the overlays of the scatter diagram and regression lines for the following data sets:
| X | Y |
|
|
1. 66 | 68 | 60 < X < 75, scale of 1 | ||
73 | 55 | 50 < Y < 70, scale of 5 | ||
6358
7159
62 65
2. | X | Y |
|
| 1500 | 99 | 1400 < X < 1900, scale of 100 |
| 1600 | 201 | 0 < Y < 500, scale of 100 |
| 1700 | 295 |
|
| 1800 | 403 |
|
Linear Regressions/STATISTICS USING THE SHARP | 43 |