For Discussion
You and your students can discuss:
1.Can you tell from the graphs which model fits the best?
2. Engage the trace and press ▼ or ▼ to move the tracer along the curve, or from data point to data point. Press ▲ or ▼ to move from the curve to the data points, or vice versa. Use this mechanism to find the error between a predicted Y value (on the regression curve) and a known Y value for a given X (one of the known points).
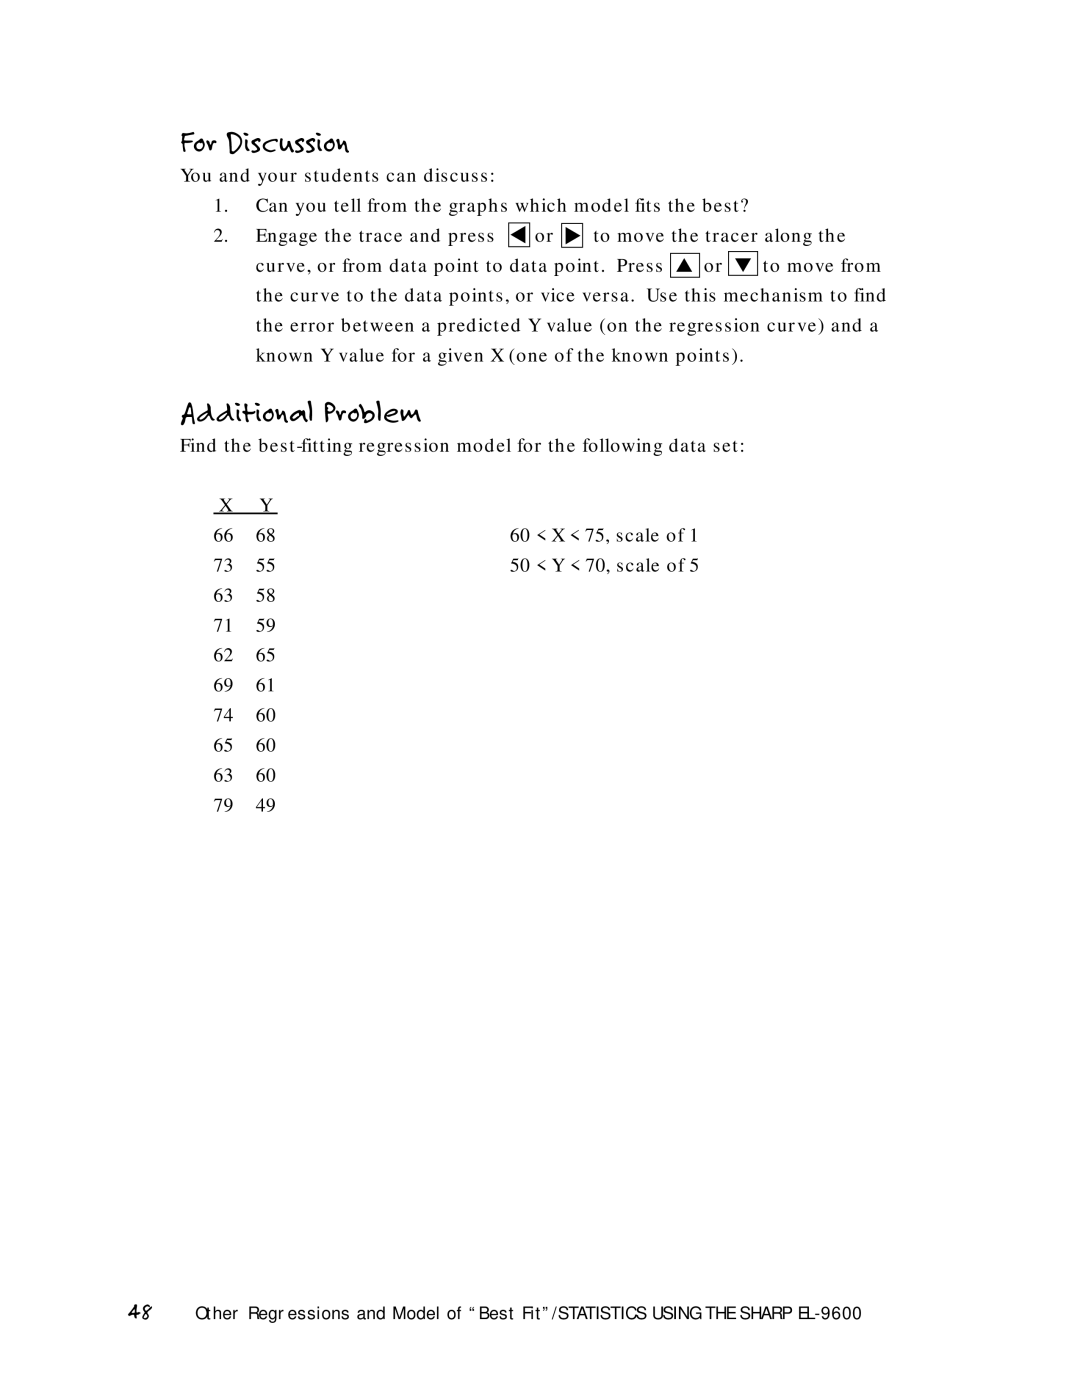
Additional Problem
Find the
X | Y |
|
66 | 68 | 60 < X < 75, scale of 1 |
73 | 55 | 50 < Y < 70, scale of 5 |
6358
7159
6265
6961
7460
6560
6360
7949
48Other Regressions and Model of “Best Fit”/STATISTICS USING THE SHARP