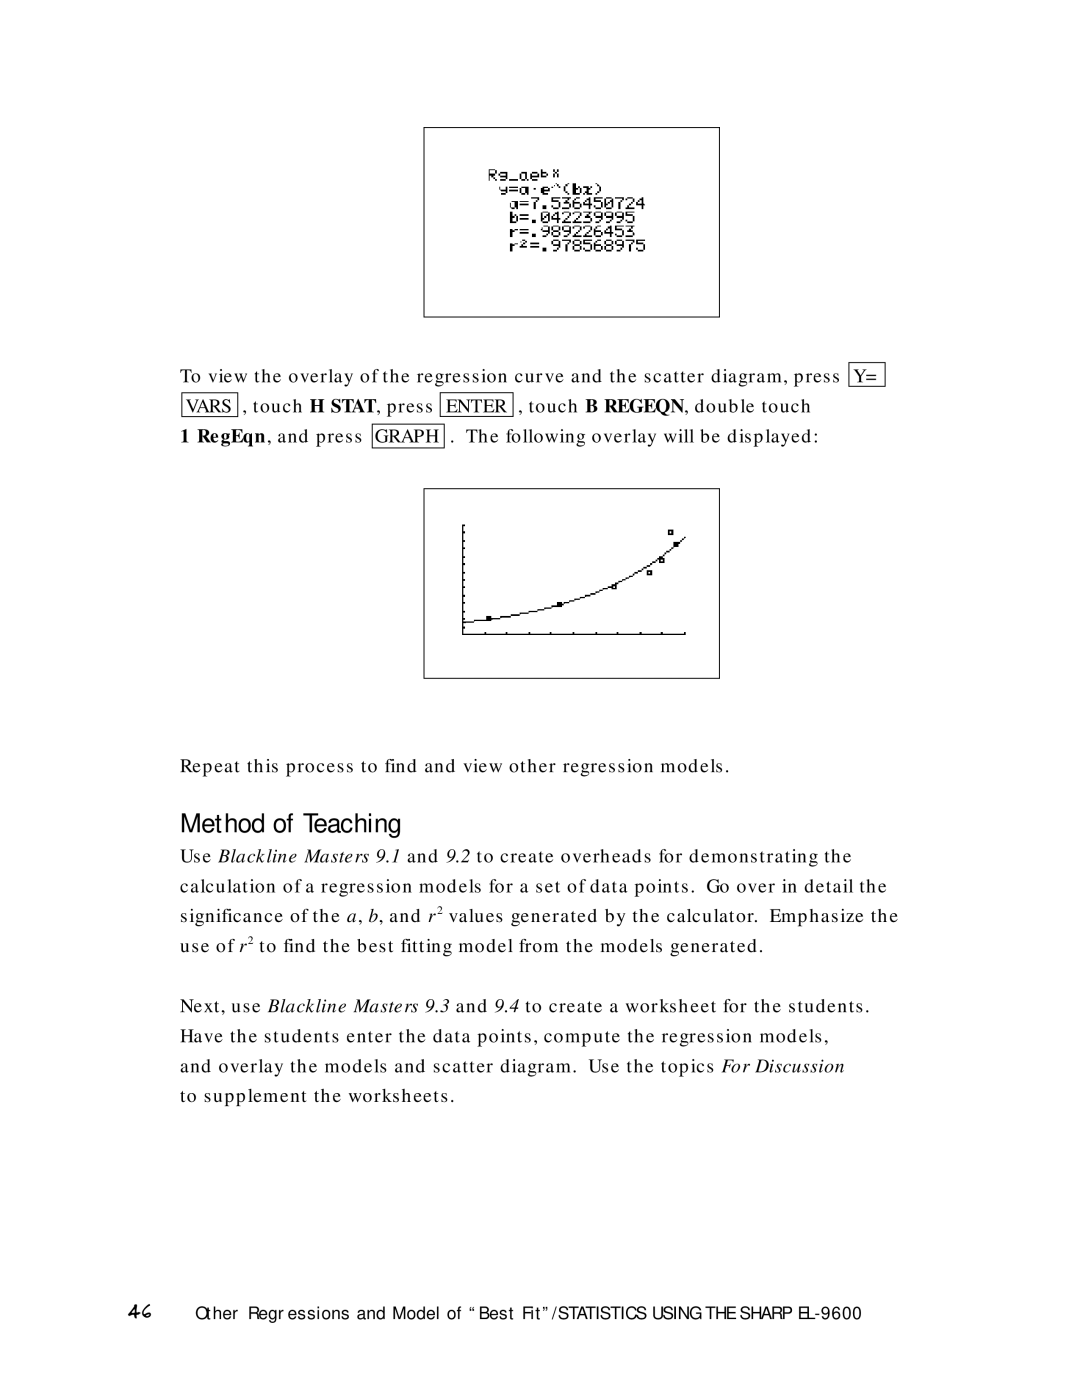
To view the overlay of the regression curve and the scatter diagram, press Y= VARS , touch H STAT, press ENTER , touch B REGEQN, double touch
1 RegEqn, and press GRAPH . The following overlay will be displayed:
Repeat this process to find and view other regression models.
Method of Teaching
Use Blackline Masters 9.1 and 9.2 to create overheads for demonstrating the calculation of a regression models for a set of data points. Go over in detail the significance of the a, b, and r 2 values generated by the calculator. Emphasize the use of r 2 to find the best fitting model from the models generated.
Next, use Blackline Masters 9.3 and 9.4 to create a worksheet for the students. Have the students enter the data points, compute the regression models, and overlay the models and scatter diagram. Use the topics For Discussion to supplement the worksheets.
46Other Regressions and Model of “Best Fit”/STATISTICS USING THE SHARP