NAME _____________________________________________________ CLASS __________ DATE __________
Copyright © 1998, Sharp Electronics Corporation. Permission is granted to photocopy for educational use only.
6.1
NUMERICAL DESCRIPTION OF
A TWO-VARIABLE DATA SET
Steps for calculating numerical descriptions of a
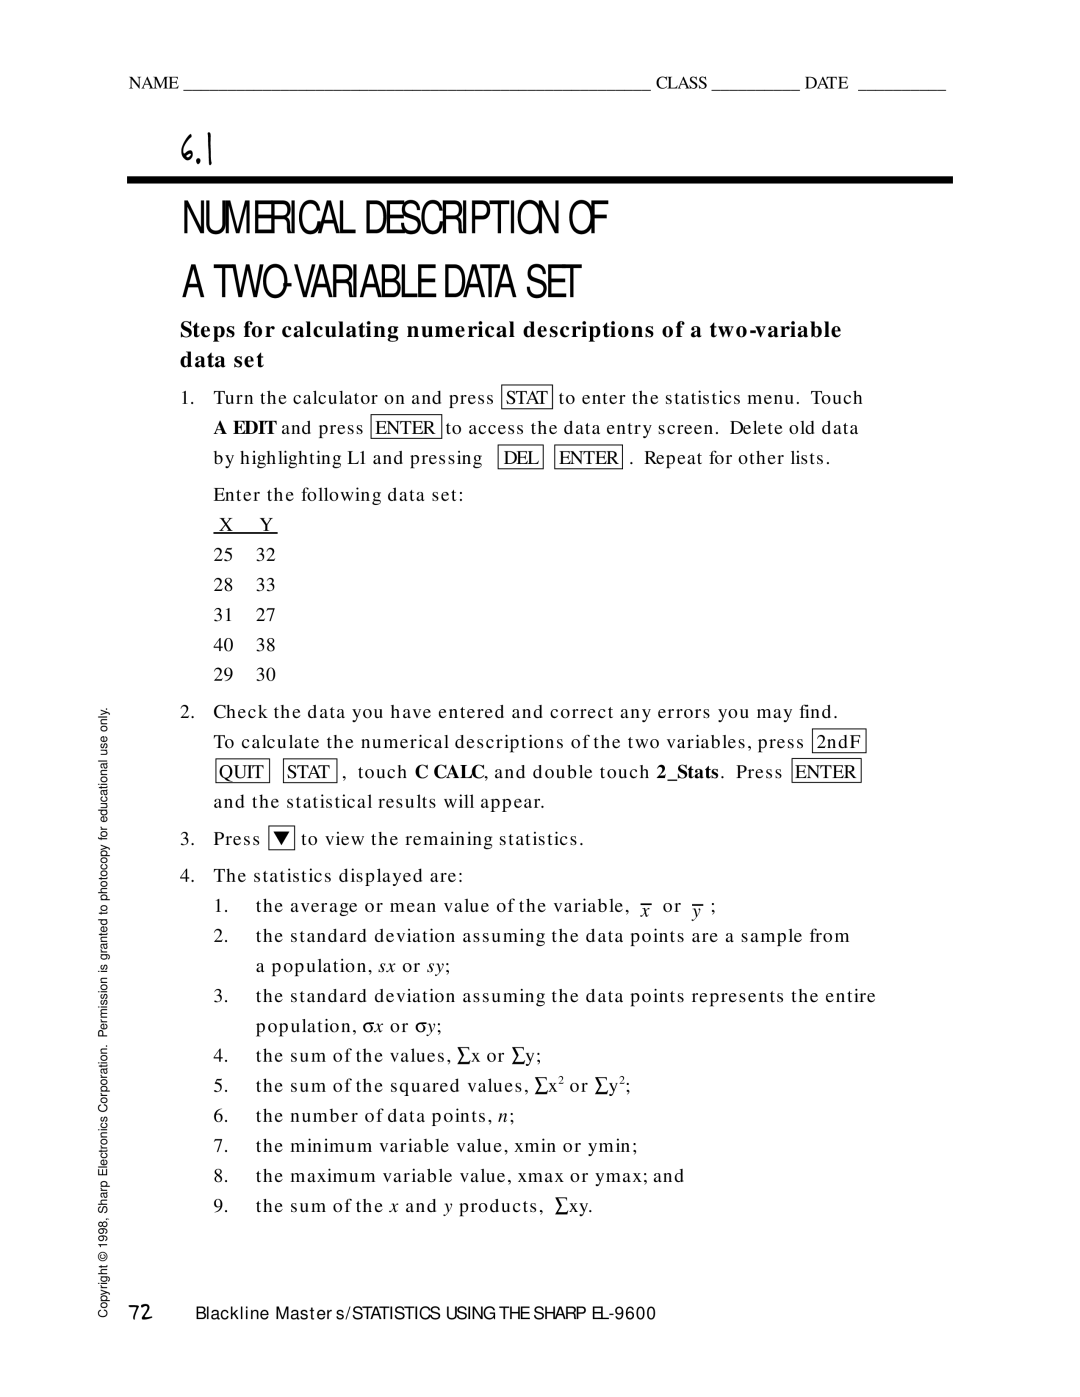
1.Turn the calculator on and press STAT to enter the statistics menu. Touch A EDIT and press ENTER to access the data entry screen. Delete old data
by highlighting L1 and pressing DEL ![]()
![]() ENTER . Repeat for other lists.
ENTER . Repeat for other lists.
Enter the following data set:
XY
2532
2833
3127
4038
2930
2.Check the data you have entered and correct any errors you may find.
To calculate the numerical descriptions of the two variables, press 2ndF QUIT ![]()
![]() STAT , touch C CALC, and double touch 2_Stats. Press ENTER and the statistical results will appear.
STAT , touch C CALC, and double touch 2_Stats. Press ENTER and the statistical results will appear.
3.Press ▼ to view the remaining statistics.
4.The statistics displayed are:
1.the average or mean value of the variable, x or y ;
2.the standard deviation assuming the data points are a sample from a population, sx or sy;
3.the standard deviation assuming the data points represents the entire population, σ x or σ y;
4.the sum of the values, ∑ x or ∑ y;
5.the sum of the squared values, ∑ x2 or ∑ y2;
6.the number of data points, n;
7.the minimum variable value, xmin or ymin;
8.the maximum variable value, xmax or ymax; and
9.the sum of the x and y products, ∑ xy.
72Blackline Masters/STATISTICS USING THE SHARP
