In our example, the smallest value is 13 and the largest value is 41. The logical intervals for the data set would be
Set the calculator to rectangular graphing by pressing 2ndF ![]()
![]() SET UP , touch E COORD, double touch 1 Rect, and press 2ndF
SET UP , touch E COORD, double touch 1 Rect, and press 2ndF ![]()
![]() QUIT . Set the viewing
QUIT . Set the viewing
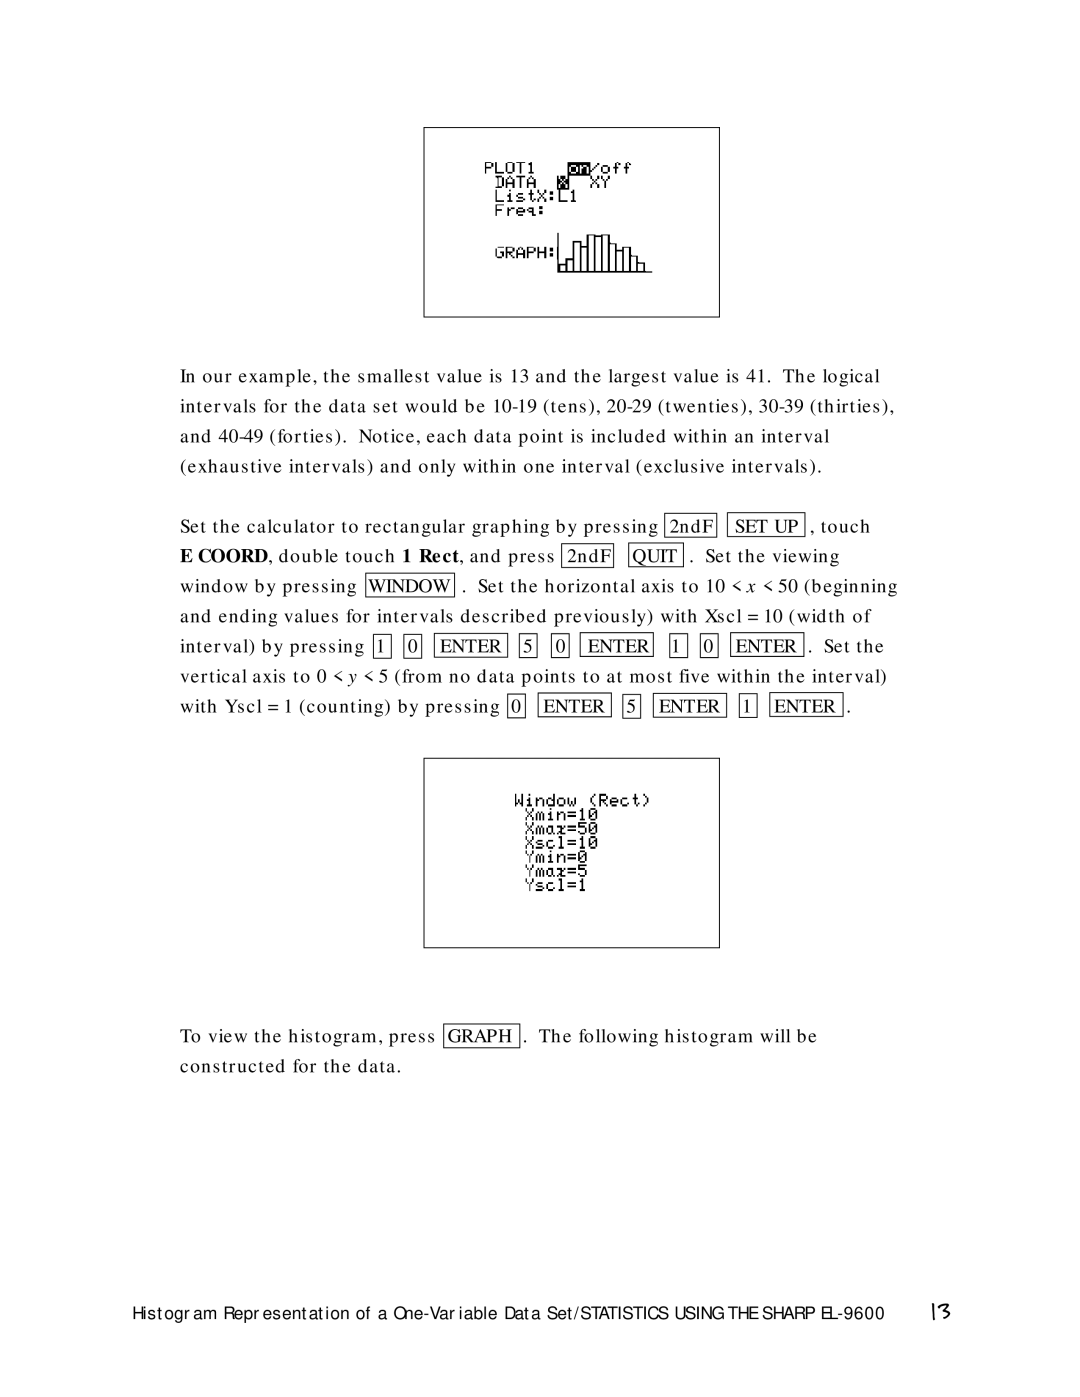
window by pressing WINDOW . Set the horizontal axis to 10 < x < 50 (beginning and ending values for intervals described previously) with Xscl = 10 (width of interval) by pressing 1 ![]()
![]() 0
0 ![]()
![]() ENTER
ENTER ![]()
![]() 5
5 ![]()
![]() 0
0 ![]()
![]() ENTER
ENTER ![]()
![]() 1
1 ![]()
![]() 0
0 ![]()
![]() ENTER . Set the vertical axis to 0 < y < 5 (from no data points to at most five within the interval) with Yscl = 1 (counting) by pressing 0
ENTER . Set the vertical axis to 0 < y < 5 (from no data points to at most five within the interval) with Yscl = 1 (counting) by pressing 0 ![]()
![]() ENTER
ENTER ![]()
![]() 5
5 ![]()
![]() ENTER
ENTER ![]()
![]() 1
1 ![]()
![]() ENTER .
ENTER .
To view the histogram, press GRAPH . The following histogram will be constructed for the data.
Histogram Representation of a | 13 |