arrow keys to move to the list, if necessary, and press ▲ to highlight the list label. Press DEL ![]()
![]() ENTER to delete the old data. Repeat for other lists of data.
ENTER to delete the old data. Repeat for other lists of data.
Move the highlighter to the cell directly below the L1 in the table and enter the
following data set: |
|
|
|
|
|
|
|
|
|
|
|
|
|
|
| ||||
15 |
| 28 | 17 | 36 | 38 | 19 |
| 13 | 25 | 27 |
| 41 |
| ||||||
by pressing 1 | 5 |
|
|
| 2 | 8 |
|
| 1 | 7 |
|
| 3 | 6 |
| ||||
ENTER | ENTER | ENTER | ENTER | ||||||||||||||||
|
|
|
|
|
|
|
|
|
|
|
|
|
|
| |||||
3 8 |
| ENTER |
| 1 9 | ENTER | 1 3 | ENTER | 2 |
| 5 | ENTER | 2 | 7 | ||||||
|
|
|
|
|
|
|
|
|
|
|
|
|
|
|
|
|
| ||
ENTER | 4 1 |
| ENTER | . |
|
|
|
|
|
|
|
|
|
|
|
| |||
Check the data you have entered by pressing ▲
to move back through the data.
Save this data set by pressing | + – |
⋅ ⎟ |
touch 1 StoLD, press 1 ![]()
![]() ENTER .
ENTER .
2ndF
LIST , touch C L_DATA, double
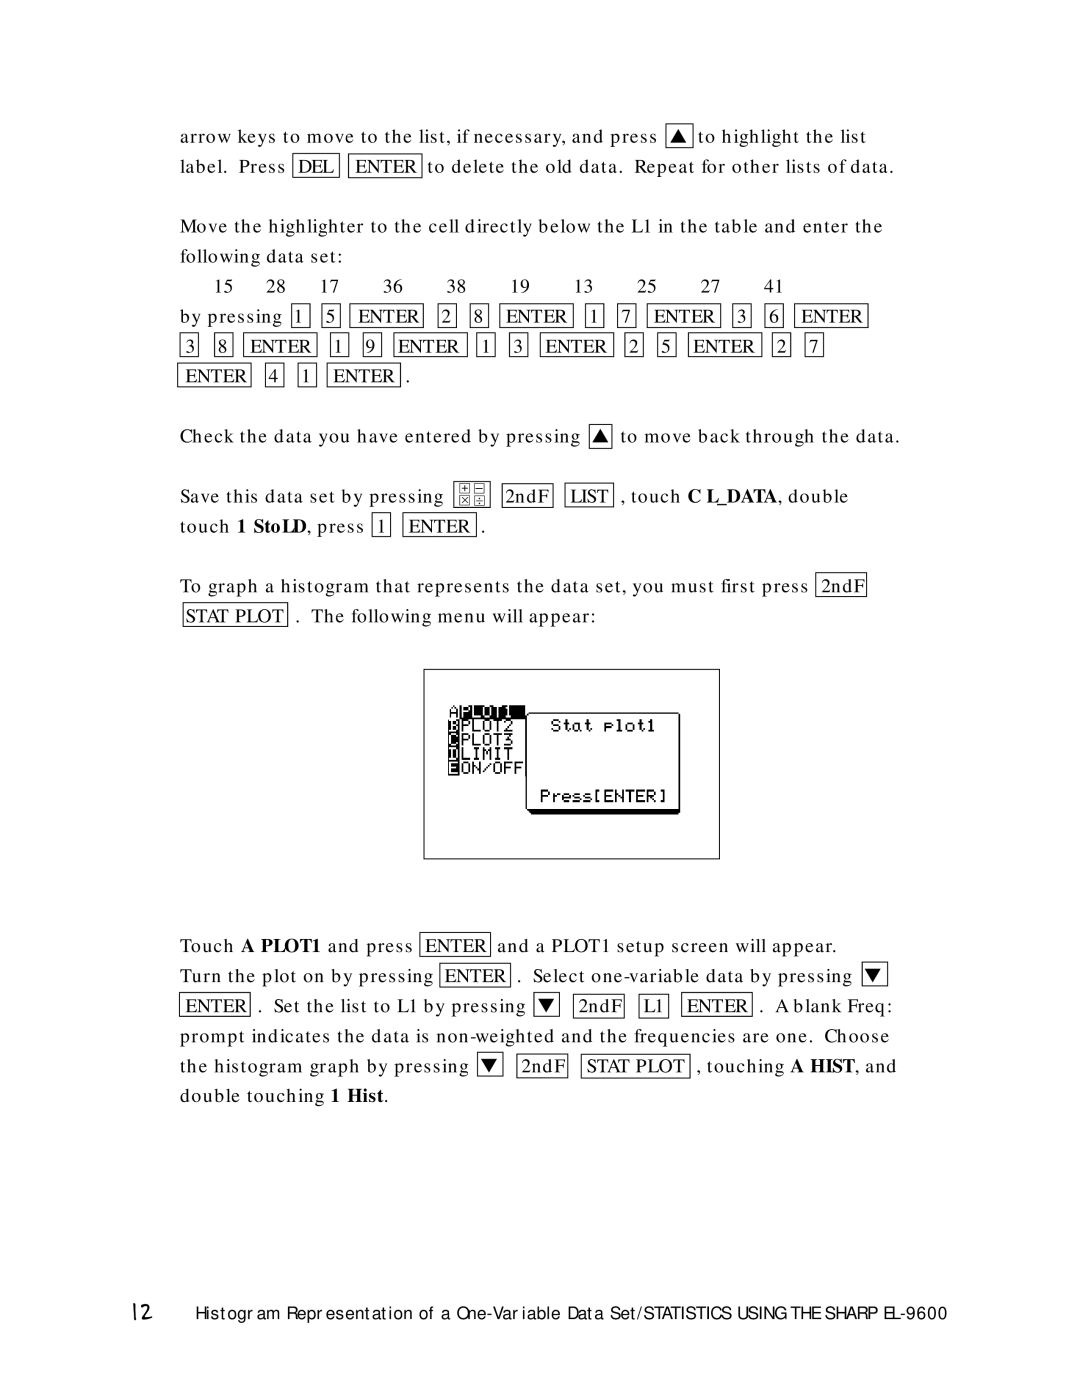
To graph a histogram that represents the data set, you must first press 2ndF STAT PLOT . The following menu will appear:
Touch A PLOT1 and press ENTER and a PLOT1 setup screen will appear.
Turn the plot on by pressing ENTER . Select
ENTER . Set the list to L1 by pressing ▼ ![]()
![]() 2ndF
2ndF ![]()
![]() L1
L1 ![]()
![]() ENTER . A blank Freq: prompt indicates the data is
ENTER . A blank Freq: prompt indicates the data is
the histogram graph by pressing ▼ double touching 1 Hist.
2ndF
STAT PLOT , touching A HIST, and
12Histogram Representation of a