Calculator Operations
Turn the calculator on and press STAT to enter the statistics menu. Touch A EDIT and press ENTER to access the data entry screen. Delete old data and enter the following data set:
X | Y |
6 | 10 |
22 | 19 |
34 | 31 |
42 | 39 |
45 | 47 |
4858
4766
Please refer to Chapter 5 for discussion on entering a
Set up the scatter diagram by pressing 2ndF
STAT PLOT , touching A PLOT1,
pressing ENTER

 ENTER
ENTER
![]()
![]() ▼
▼ ![]()
![]()
▼![]()
![]()
ENTER 
 ▼
▼ 
 2ndF
2ndF
L1
ENTER
2ndF
L2
ENTER
2ndF
STAT PLOT , touching G S.D., and double touching 3 Scattr.
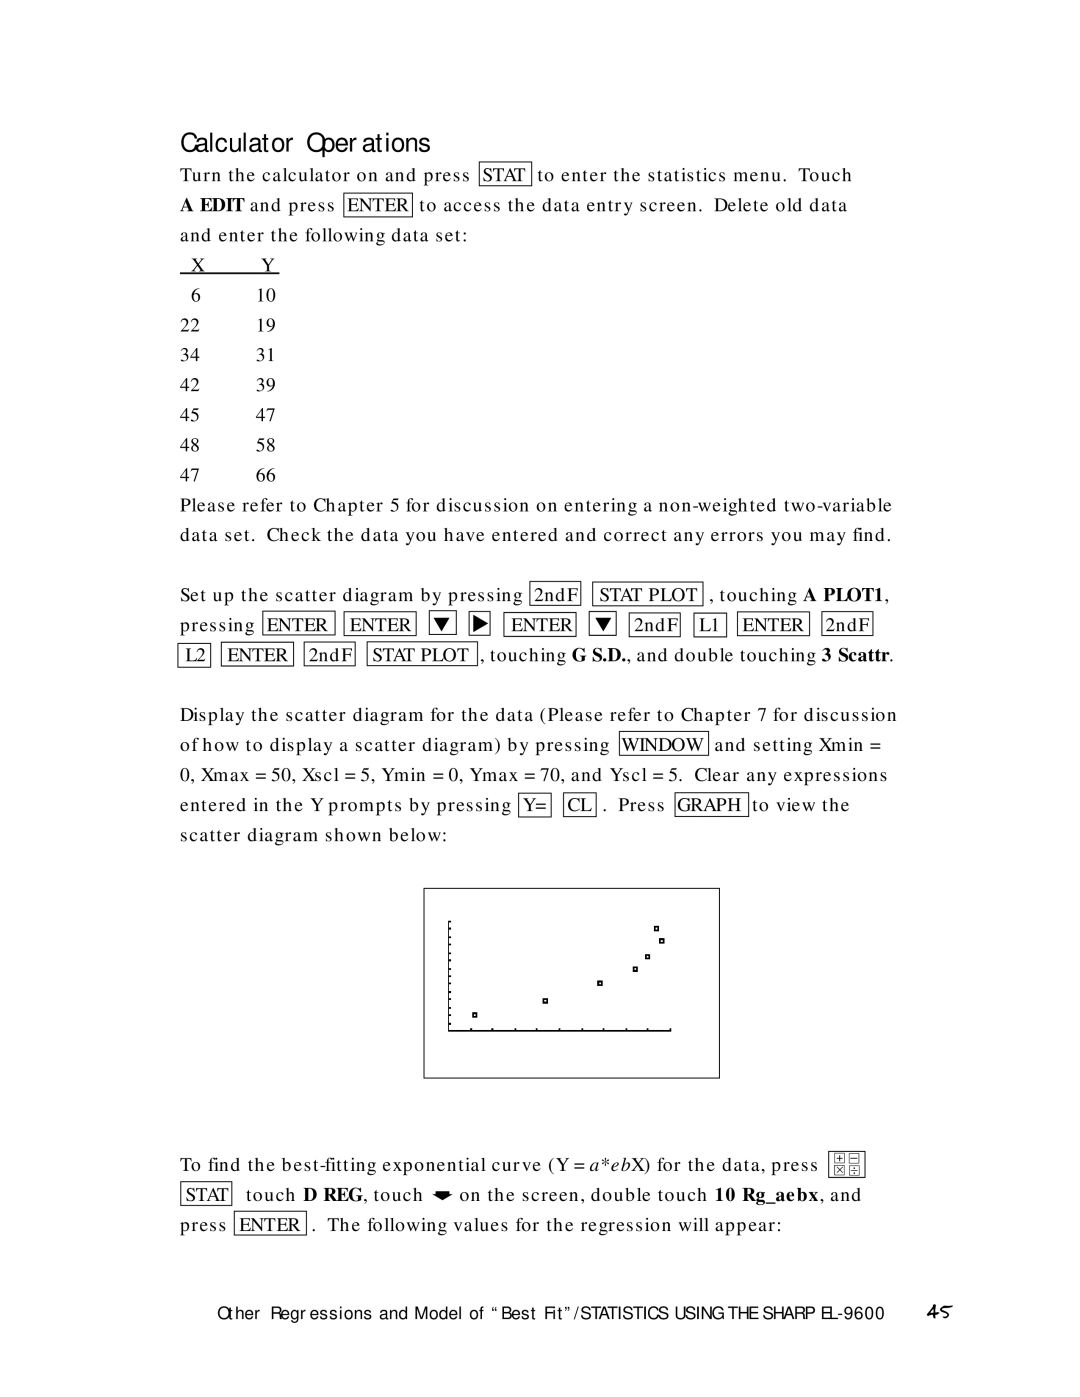
Display the scatter diagram for the data (Please refer to Chapter 7 for discussion of how to display a scatter diagram) by pressing WINDOW and setting Xmin = 0, Xmax = 50, Xscl = 5, Ymin = 0, Ymax = 70, and Yscl = 5. Clear any expressions entered in the Y prompts by pressing Y= ![]()
![]() CL . Press GRAPH to view the scatter diagram shown below:
CL . Press GRAPH to view the scatter diagram shown below:
To find the | + – | ||||
⋅ ⎟ | |||||
| touch D REG, touch |
| on the screen, double touch 10 Rg_aebx, and | ||
STAT | ➧ | ||||
|
|
|
|
| |
press | ENTER | . The following values for the regression will appear: |
| ||
Other Regressions and Model of “Best Fit”/STATISTICS USING THE SHARP | 45 |