NAME _____________________________________________________ CLASS __________ DATE __________
8.3
LINEAR REGRESSIONS
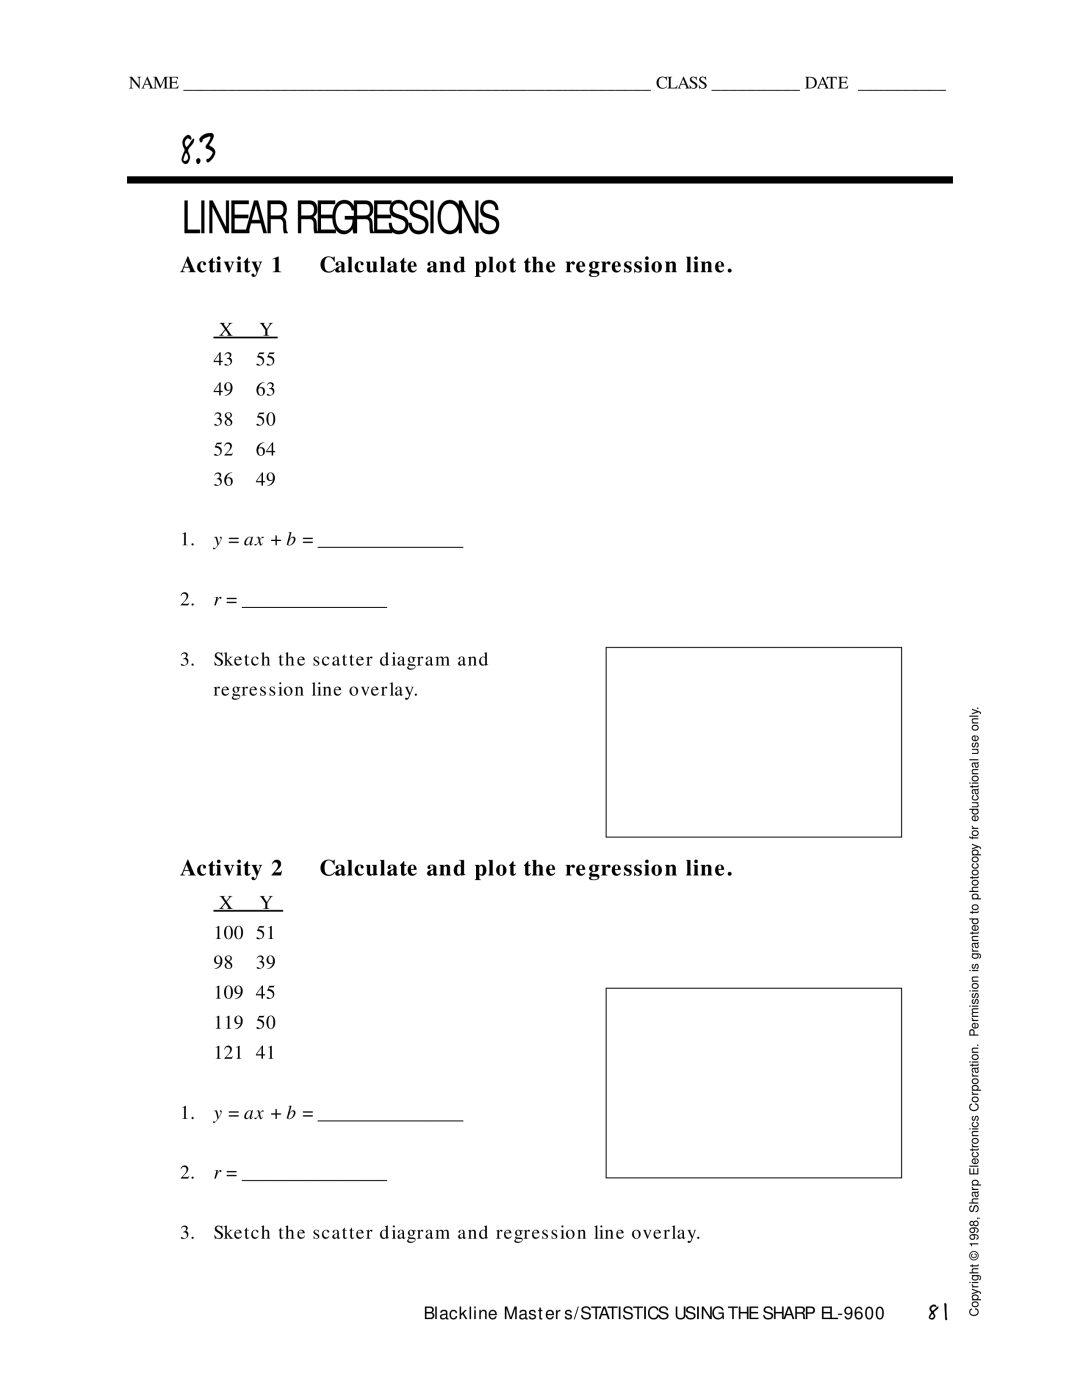
Activity 1 Calculate and plot the regression line.
XY
43 55
49 63
38 50
52 64
36 49
1.y = ax + b = _______________
2.r = _______________
3.Sketch the scatter diagram and regression line overlay.
Activity 2 Calculate and plot the regression line.
XY
100 51
98 39
109 45
119 50
121 41
1.y = ax + b = _______________
2.r = _______________
3.Sketch the scatter diagram and regression line overlay.
Blackline Masters/STATISTICS USING THE SHARP
81
Copyright © 1998, Sharp Electronics Corporation. Permission is granted to photocopy for educational use only.
