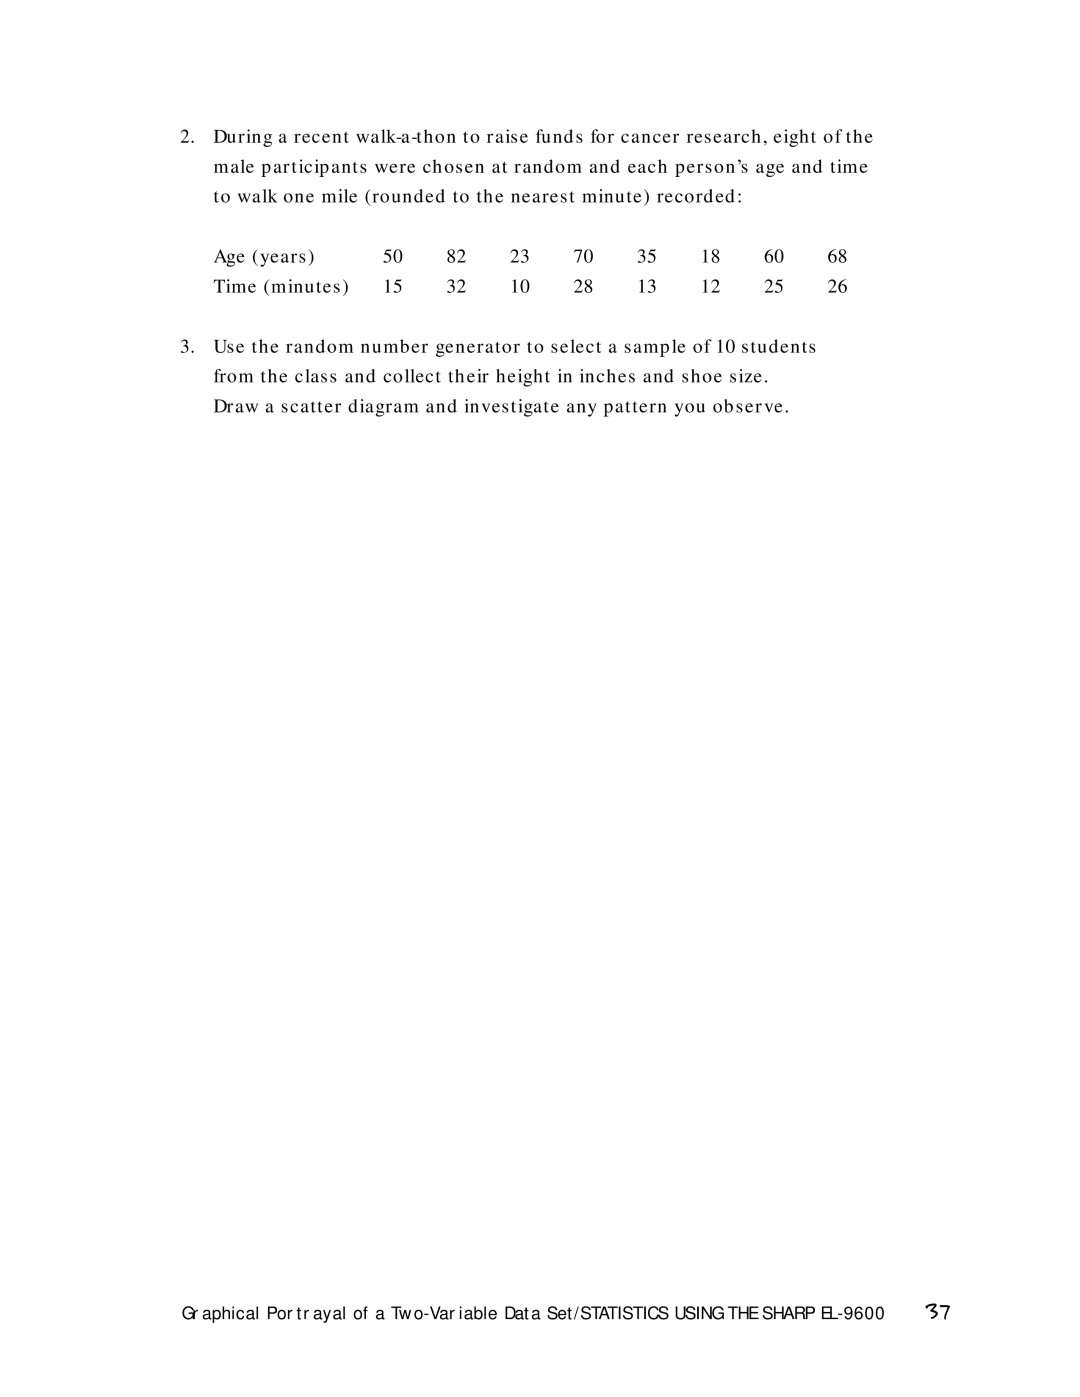
2.During a recent
Age (years) | 50 | 82 | 23 | 70 | 35 | 18 | 60 | 68 |
Time (minutes) | 15 | 32 | 10 | 28 | 13 | 12 | 25 | 26 |
3.Use the random number generator to select a sample of 10 students from the class and collect their height in inches and shoe size. Draw a scatter diagram and investigate any pattern you observe.
Graphical Portrayal of a | 37 |
