To overlay the regression line and the scatter diagram for the data, you must first set up the scatter diagram by pressing 2ndF ![]()
![]() STAT PLOT , touching
STAT PLOT , touching
A PLOT1, pressing ENTER
2ndF ![]()
![]() L2
L2 ![]()
![]() ENTER
ENTER ![]()
![]() 2ndF
2ndF ![]()
![]()
3 Scattr.
ENTER | ▼ | ▼ | ENTER | ▼ | 2ndF | L1 | ENTER |
STAT PLOT , touching G S.D., and double touching
Display the scatter diagram for the data by pressing WINDOW and setting Xmin = 10, Xmax = 30, Xscl = 5, Ymin = 15, Ymax = 40, and Yscl = 5. Press Y= CL to clear any previously entered expressions. Press GRAPH to view the scatter diagram.
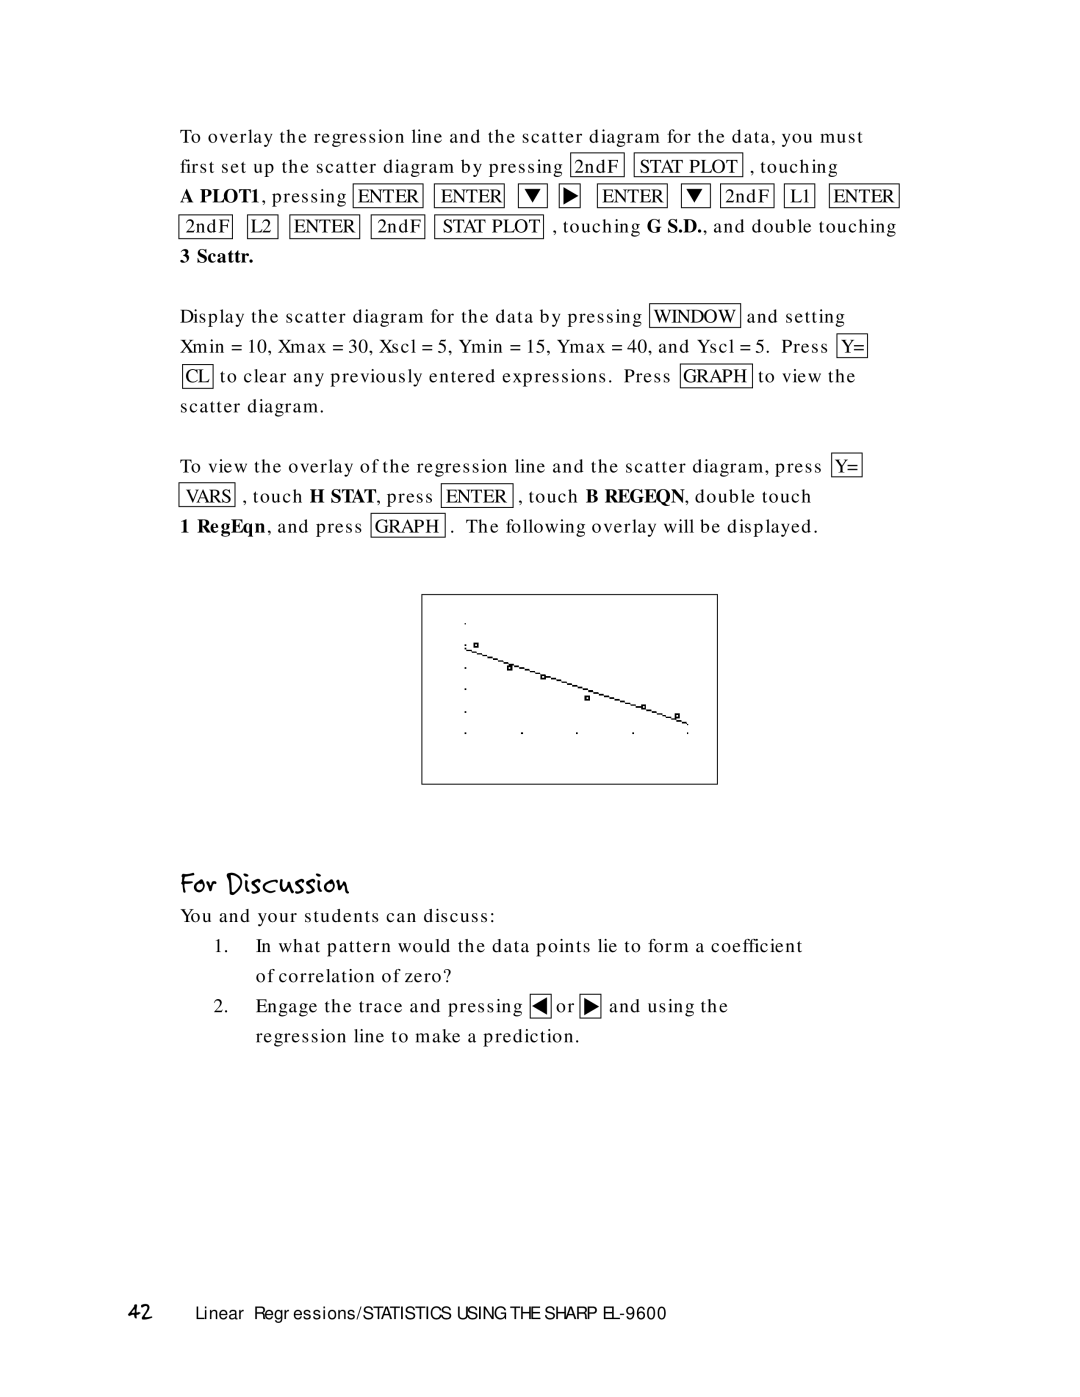
To view the overlay of the regression line and the scatter diagram, press Y= VARS , touch H STAT, press ENTER , touch B REGEQN, double touch
1 RegEqn, and press GRAPH . The following overlay will be displayed.
For Discussion
You and your students can discuss:
1.In what pattern would the data points lie to form a coefficient
of correlation of zero? |
|
2. Engage the trace and pressing | ▼ or ▼ and using the |
regression line to make a prediction.