Enter the data by first pressing | STAT | to access the statistics menu. | Touch | ||
|
|
|
| ||
A EDIT and press | ENTER | to access the statistics data entry screen. | To delete | ||
old data, highlight L1 and press | DEL |
|
| ENTER | to delete List 1. Repeat for |
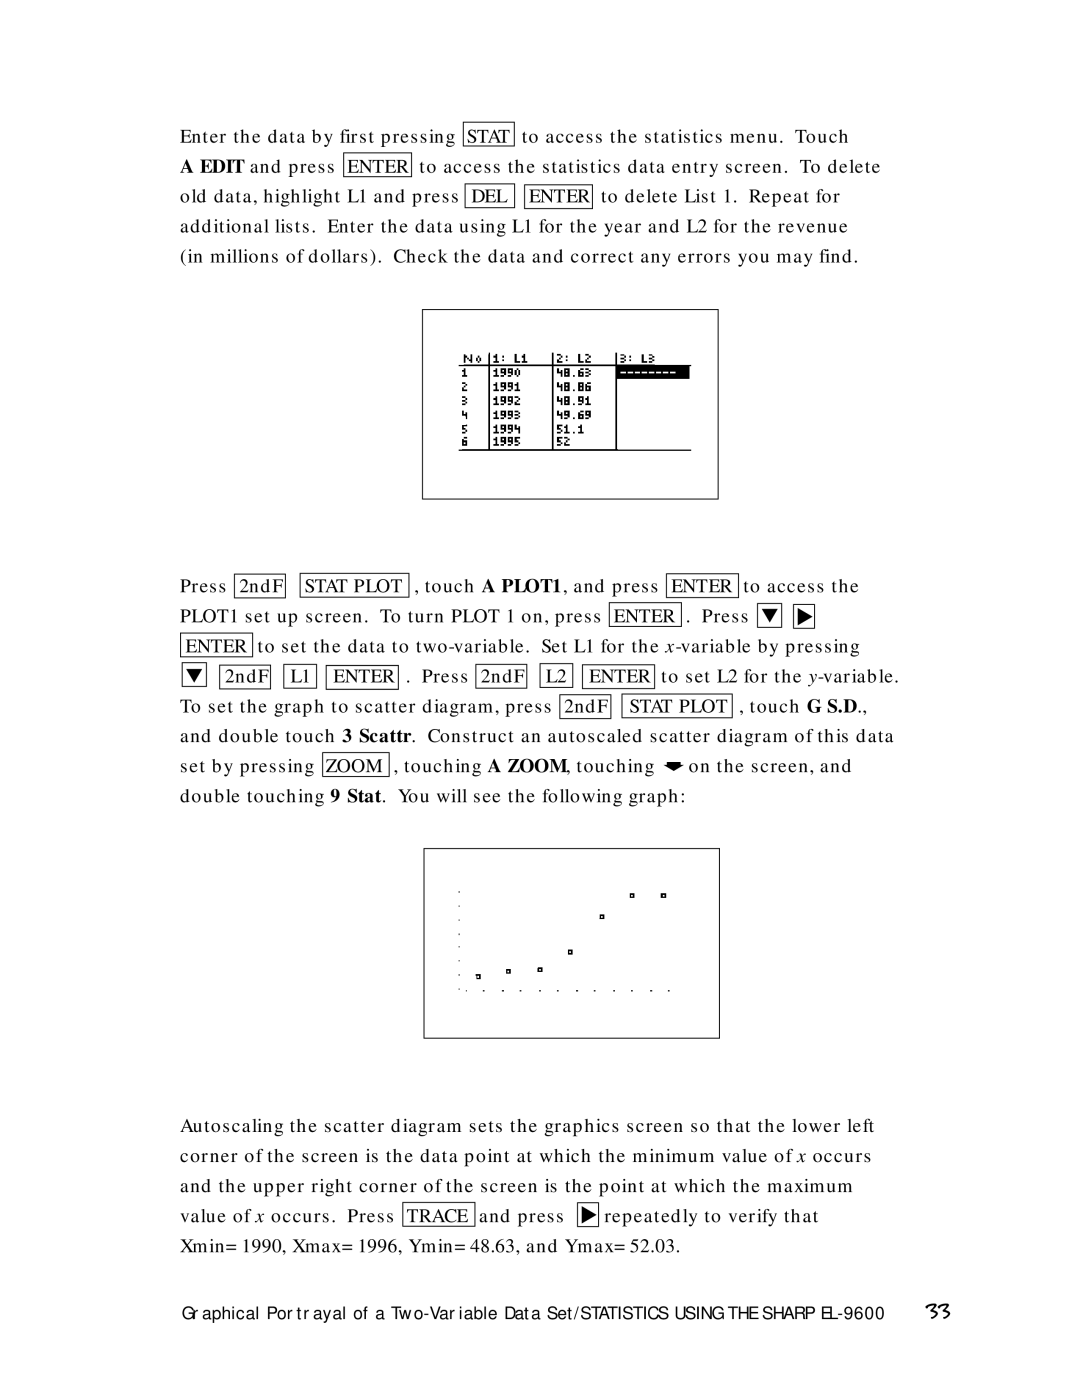
additional lists. Enter the data using | L1 for the year and L2 for the revenue | ||||
(in millions of dollars). Check the data and correct any errors you may find.
Press 2ndF
STAT PLOT , touch A PLOT1, and press ENTER to access the
PLOT1 set up screen. To turn PLOT 1 on, press ENTER . Press ▼
![]()
![]() ▼
▼
ENTER to set the data to
▼ ![]()
![]() 2ndF
2ndF ![]()
![]() L1
L1 ![]()
![]() ENTER . Press 2ndF
ENTER . Press 2ndF ![]()
![]() L2
L2 ![]()
![]() ENTER to set L2 for the
ENTER to set L2 for the ![]()
![]() STAT PLOT , touch G S.D., and double touch 3 Scattr. Construct an autoscaled scatter diagram of this data set by pressing ZOOM , touching A ZOOM, touching ➧ on the screen, and double touching 9 Stat. You will see the following graph:
STAT PLOT , touch G S.D., and double touch 3 Scattr. Construct an autoscaled scatter diagram of this data set by pressing ZOOM , touching A ZOOM, touching ➧ on the screen, and double touching 9 Stat. You will see the following graph:
Autoscaling the scatter diagram sets the graphics screen so that the lower left corner of the screen is the data point at which the minimum value of x occurs and the upper right corner of the screen is the point at which the maximum value of x occurs. Press TRACE and press ▼ repeatedly to verify that Xmin= 1990, Xmax= 1996, Ymin= 48.63, and Ymax= 52.03.
Graphical Portrayal of a | 33 |