Method of Teaching
Use Blackline Masters 8.1 and 8.2 to create overheads for demonstrating the calculation of a regression line for a set of data points, and the display of an overlay of the scatter diagram for the data points and the regression line. Go over in detail the significance of the a, b, and r values generated by the calculator.
Next, use Blackline Master 8.3 to create a worksheet for the students. Have the students enter the data points, compute the regression line, and display the overlay of the scatter diagram and regression line. Use the topics For Discussion to supplement the worksheets.
Using Blackline Master 8.2
Press STAT to enter the statistics menu. Access the data entry screen by touching A EDIT and pressing ENTER . Delete old data and enter the following data set:
XY
11 35
14 30
17 28
21 23
26 21
29 19
Check the data you have entered and correct any errors you may find.
To find the | + | – |
⋅ | ⎟ |
STAT ,
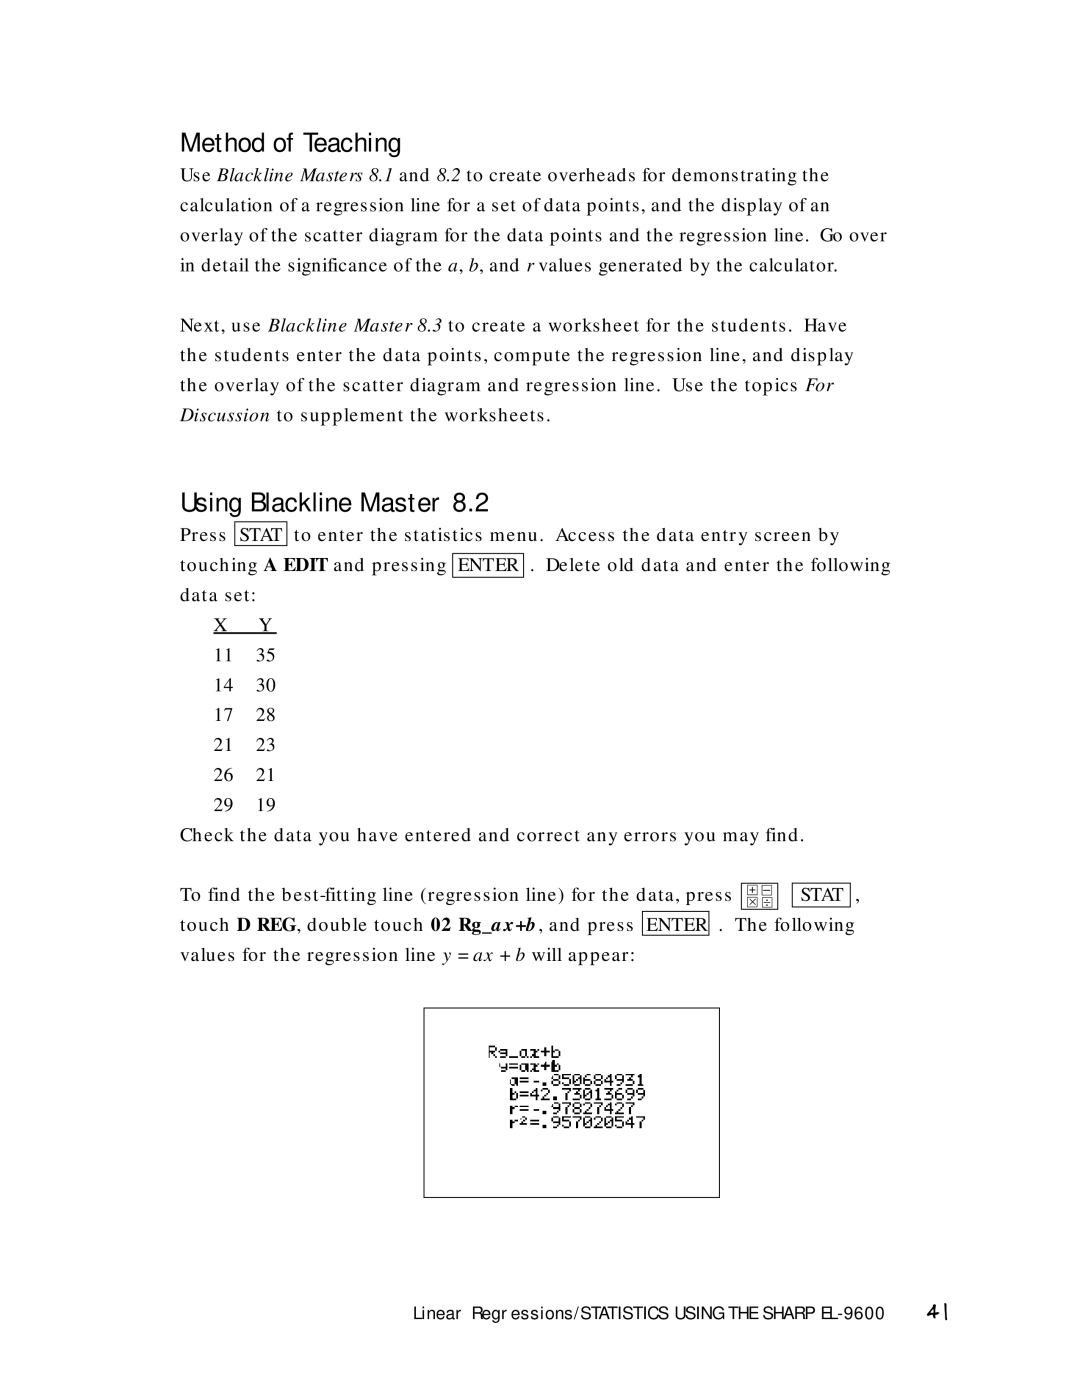
touch D REG, double touch 02 Rg_ax+b, and press ENTER . The following values for the regression line y = ax + b will appear:
Linear Regressions/STATISTICS USING THE SHARP | 41 |