Press 2ndF ![]()
![]() EXE to compute the statistical test. The following results will be displayed. Press ▼ to see the rest of the results.
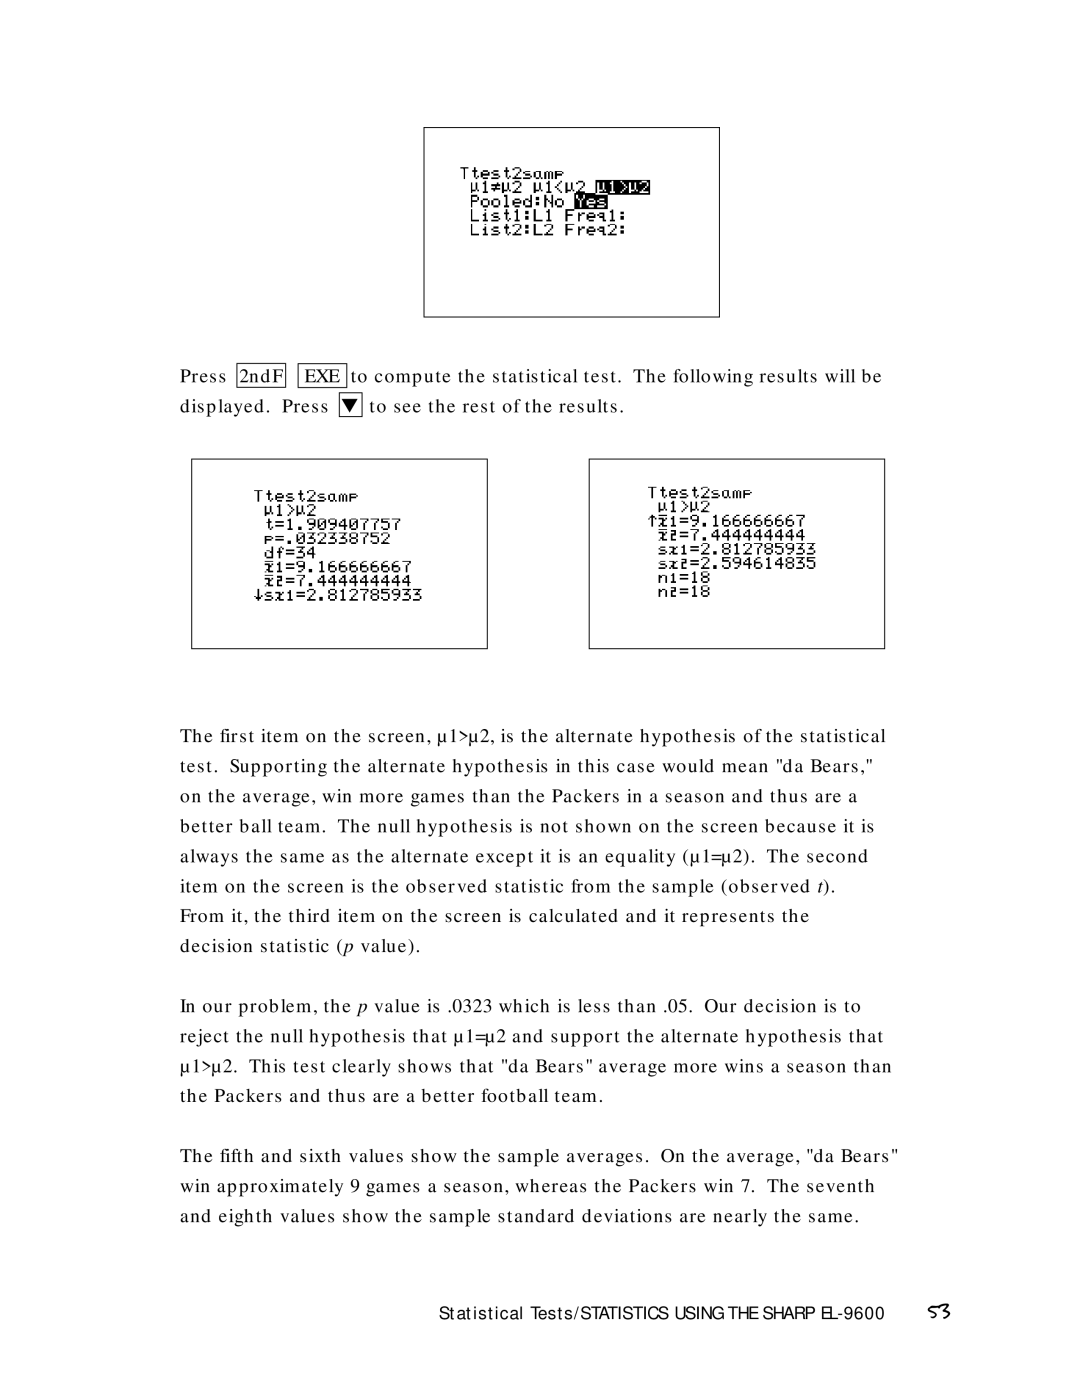
EXE to compute the statistical test. The following results will be displayed. Press ▼ to see the rest of the results.
The first item on the screen, µ1>µ2, is the alternate hypothesis of the statistical test. Supporting the alternate hypothesis in this case would mean "da Bears," on the average, win more games than the Packers in a season and thus are a better ball team. The null hypothesis is not shown on the screen because it is always the same as the alternate except it is an equality (µ1=µ2). The second item on the screen is the observed statistic from the sample (observed t). From it, the third item on the screen is calculated and it represents the decision statistic (p value).
In our problem, the p value is .0323 which is less than .05. Our decision is to reject the null hypothesis that µ1=µ2 and support the alternate hypothesis that µ1>µ2. This test clearly shows that "da Bears" average more wins a season than the Packers and thus are a better football team.
The fifth and sixth values show the sample averages. On the average, "da Bears" win approximately 9 games a season, whereas the Packers win 7. The seventh and eighth values show the sample standard deviations are nearly the same.
Statistical Tests/STATISTICS USING THE SHARP | 53 |