Press 2ndF ![]()
![]() STAT PLOT , touch A PLOT1, and press ENTER and a PLOT1 setup screen will appear. Turn the plot on by pressing ENTER . Select
STAT PLOT , touch A PLOT1, and press ENTER and a PLOT1 setup screen will appear. Turn the plot on by pressing ENTER . Select
![]()
![]() ENTER Set the list to L1 by pressing ▼ 2ndF
ENTER Set the list to L1 by pressing ▼ 2ndF ![]()
![]() L1
L1 ![]()
![]() ENTER . Set the frequencies to L2 by pressing 2ndF
ENTER . Set the frequencies to L2 by pressing 2ndF ![]()
![]() L2
L2 ![]()
![]() ENTER . Choose the histogram graph by pressing 2ndF
ENTER . Choose the histogram graph by pressing 2ndF ![]()
![]() STAT PLOT , touching A HIST, and double touching 1 Hist.
STAT PLOT , touching A HIST, and double touching 1 Hist.
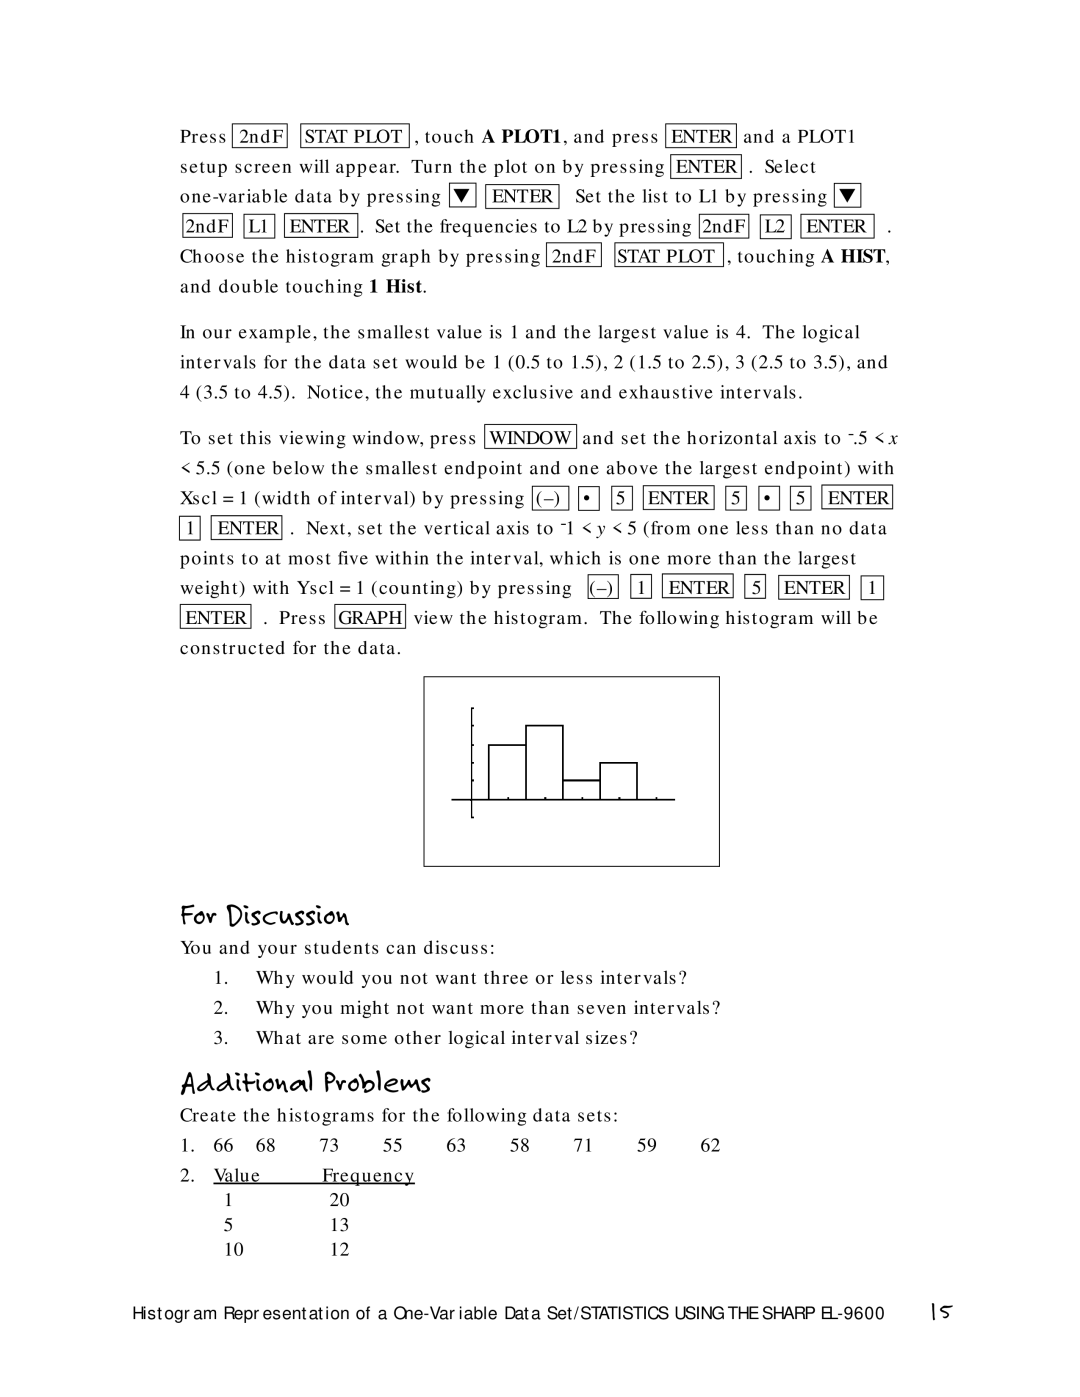
In our example, the smallest value is 1 and the largest value is 4. The logical intervals for the data set would be 1 (0.5 to 1.5), 2 (1.5 to 2.5), 3 (2.5 to 3.5), and 4 (3.5 to 4.5). Notice, the mutually exclusive and exhaustive intervals.
To set this viewing window, press WINDOW and set the horizontal axis to
< 5.5 (one below the smallest endpoint and one above the largest endpoint) with Xscl = 1 (width of interval) by pressing ![]()
![]() •
• ![]()
![]() 5
5 ![]()
![]() ENTER
ENTER ![]()
![]() 5
5 ![]()
![]() •
• ![]()
![]() 5
5 ![]()
![]() ENTER 1
ENTER 1 ![]()
![]() ENTER . Next, set the vertical axis to
ENTER . Next, set the vertical axis to ![]()
![]() 1
1 ![]()
![]() ENTER
ENTER ![]()
![]() 5
5 ![]()
![]() ENTER
ENTER ![]()
![]() 1 ENTER . Press GRAPH view the histogram. The following histogram will be constructed for the data.
1 ENTER . Press GRAPH view the histogram. The following histogram will be constructed for the data.
For Discussion
You and your students can discuss:
1.Why would you not want three or less intervals?
2.Why you might not want more than seven intervals?
3.What are some other logical interval sizes?
Additional Problems
Create the histograms for the following data sets:
1. | 66 | 68 | 73 | 55 | 63 | 58 | 71 | 59 | 62 |
2. | Value | Frequency |
|
|
|
|
| ||
| 1 |
| 20 |
|
|
|
|
|
|
513
1012
Histogram Representation of a | 15 |