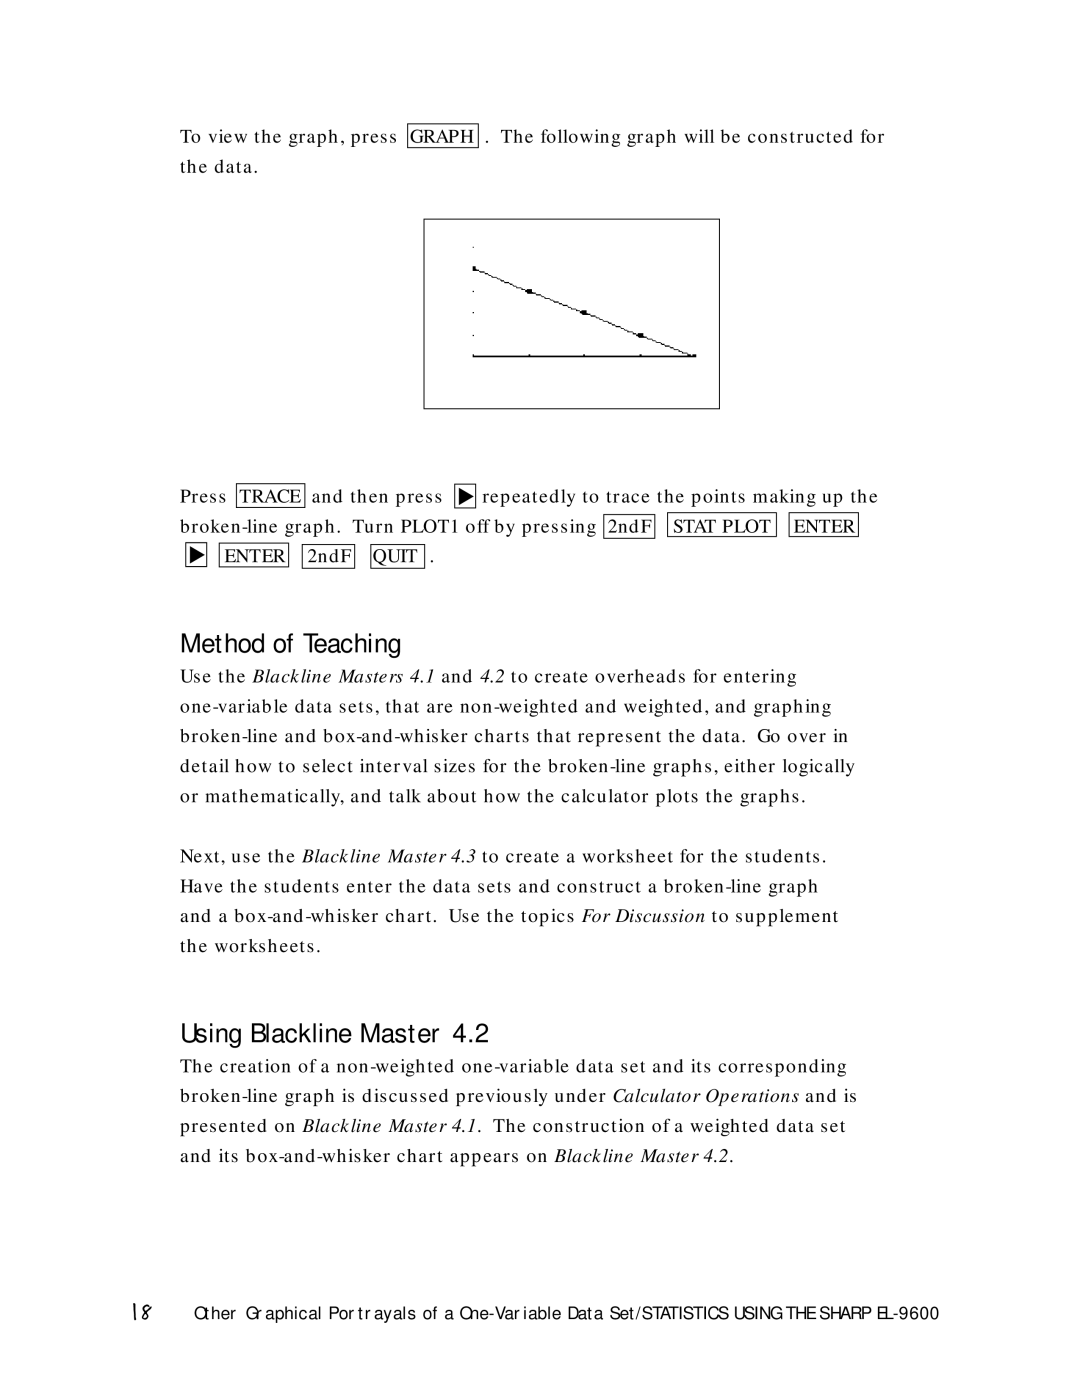
To view the graph, press GRAPH . The following graph will be constructed for the data.
Press | TRACE | and then press | ▼ repeatedly to trace the points making up the |
broken-line graph. Turn PLOT1 off by pressing 2ndF 
 STAT PLOT
 ENTER
ENTER
Method of Teaching
Use the Blackline Masters 4.1 and 4.2 to create overheads for entering one-variable data sets, that are non-weighted and weighted, and graphing broken-line and box-and-whisker charts that represent the data. Go over in detail how to select interval sizes for the broken-line graphs, either logically or mathematically, and talk about how the calculator plots the graphs.
Next, use the Blackline Master 4.3 to create a worksheet for the students. Have the students enter the data sets and construct a broken-line graph and a box-and-whisker chart. Use the topics For Discussion to supplement the worksheets.
Using Blackline Master 4.2
The creation of a non-weighted one-variable data set and its corresponding broken-line graph is discussed previously under Calculator Operations and is presented on Blackline Master 4.1. The construction of a weighted data set and its box-and-whisker chart appears on Blackline Master 4.2.
18Other Graphical Portrayals of a One-Variable Data Set/STATISTICS USING THE SHARP EL-9600