Calculator Operations
Turn the calculator on and press |
| STAT | to enter the statistics menu. |
|
|
| ||||||||||||||||
Delete old data and enter the following data set for L1: |
|
|
|
|
|
| ||||||||||||||||
| 15 | 28 | 17 | 36 | 38 |
|
| 19 | 13 |
| 25 | 27 | 41 |
|
|
| ||||||
|
|
|
|
|
|
|
|
|
|
|
|
|
|
|
|
|
|
|
|
|
| |
by pressing 1 | 5 | ENTER | 2 |
| 8 | ENTER | 1 | 7 |
| ENTER | 3 | 6 | ENTER |
| ||||||||
|
|
|
|
|
|
|
|
|
|
|
|
|
|
|
|
|
|
|
|
|
|
|
3 | 8 | ENTER | 1 | 9 | ENTER |
| 1 | 3 | ENTER | 2 | 5 | ENTER | 2 | 7 | ENTER | |||||||
4 | 1 |
|
|
|
|
|
|
|
|
|
|
|
|
|
|
|
|
|
|
|
|
|
ENTER | . |
|
|
|
|
|
|
|
|
|
|
|
|
|
|
|
|
|
| |||
Check the data you have entered by pressing ▲
to move back through the data.
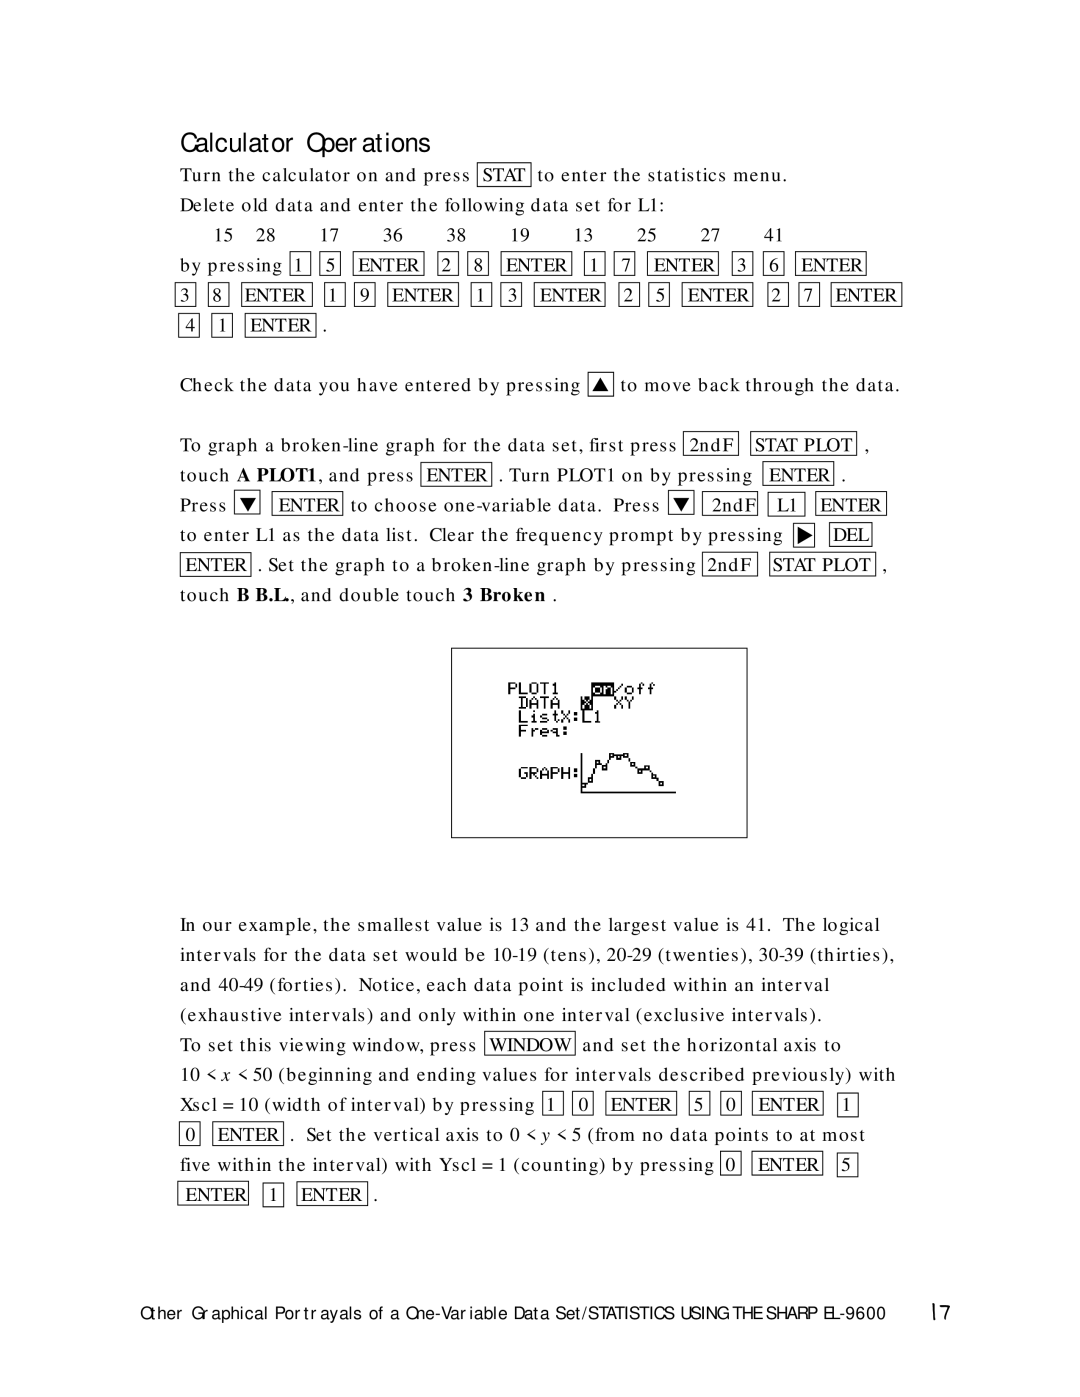
To graph a ![]()
![]() STAT PLOT , touch A PLOT1, and press ENTER . Turn PLOT1 on by pressing ENTER .
STAT PLOT , touch A PLOT1, and press ENTER . Turn PLOT1 on by pressing ENTER .
Press ▼ ![]()
![]() ENTER to choose
ENTER to choose ![]()
![]() 2ndF
2ndF ![]()
![]() L1 to enter L1 as the data list. Clear the frequency prompt by pressing ▼
L1 to enter L1 as the data list. Clear the frequency prompt by pressing ▼
ENTER 
 DEL
DEL
ENTER . Set the graph to a ![]()
![]() STAT PLOT , touch B B.L., and double touch 3 Broken .
STAT PLOT , touch B B.L., and double touch 3 Broken .
In our example, the smallest value is 13 and the largest value is 41. The logical intervals for the data set would be
and
10 < x < 50 (beginning and ending values for intervals described previously) with
Xscl = 10 (width of interval) by pressing 1 0 | ENTER | 5 | 0 | ENTER | 1 | |||||
|
|
|
|
|
|
|
|
|
| |
0 | ENTER | . Set the vertical axis to 0 < y < 5 (from no data points to at most | ||||||||
|
|
|
|
|
|
|
|
|
|
|
five within the interval) with Yscl = 1 (counting) by pressing | 0 | ENTER | 5 | |||||||
|
|
|
|
|
|
|
|
|
|
|
ENTER | 1 |
| ENTER | . |
|
|
|
|
| |
Other Graphical Portrayals of a | 17 |