Using Blackline Master 10.2
Press STAT to enter the statistics menu. Touch A EDIT and press ENTER to access the data entry screen. Enter the additional data for L2:
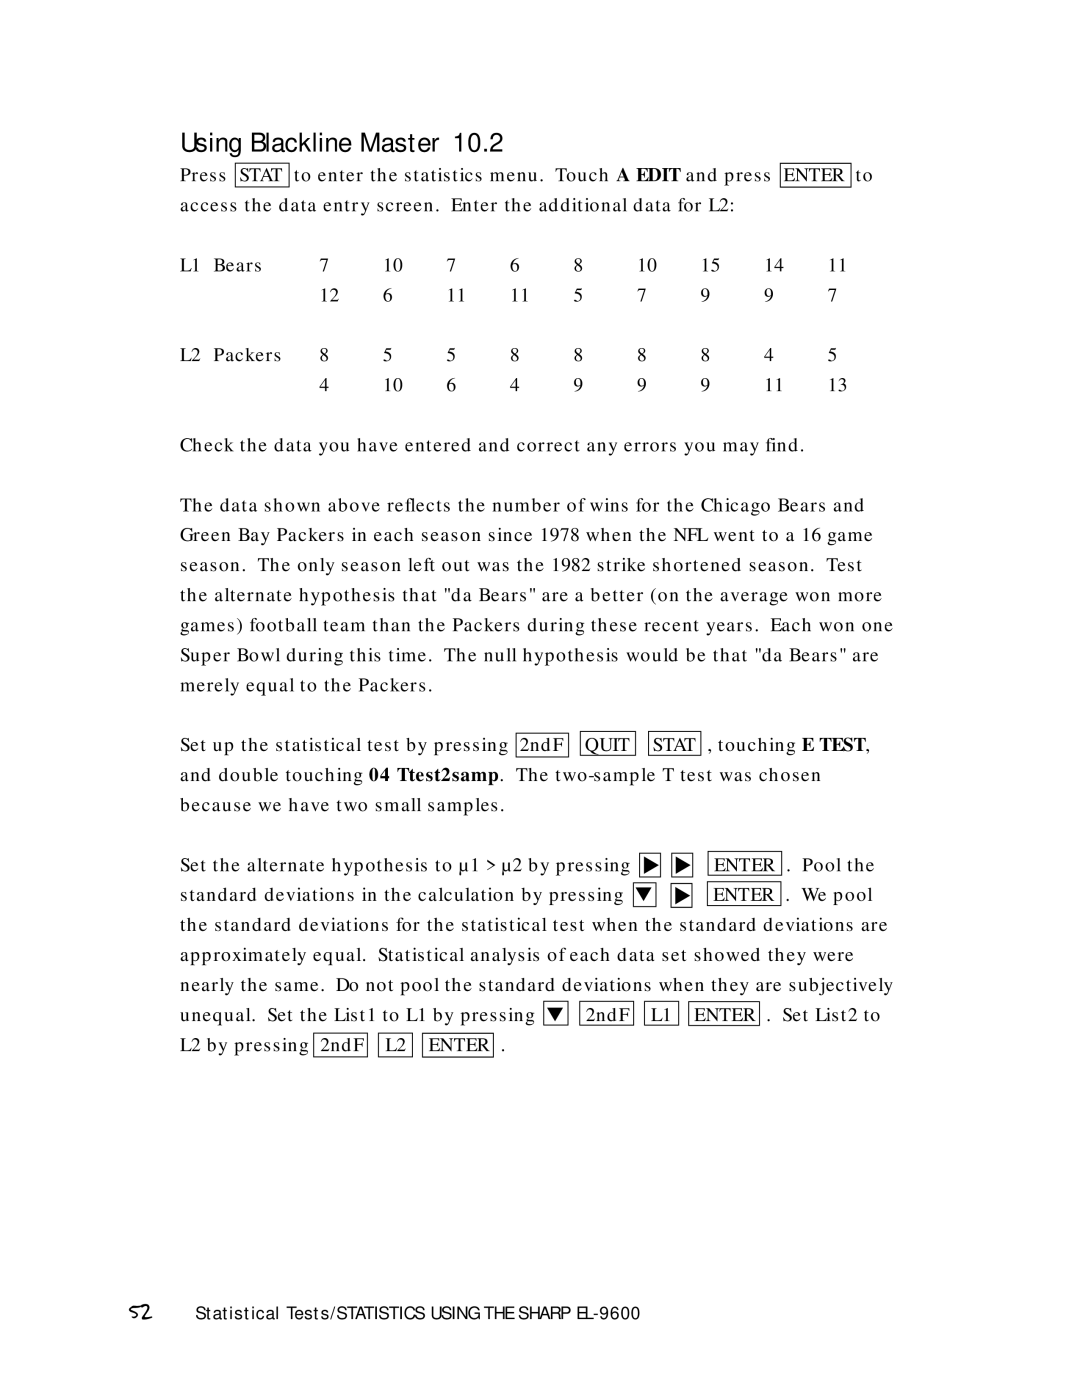
L1 | Bears | 7 | 10 | 7 | 6 | 8 | 10 | 15 | 14 | 11 |
|
| 12 | 6 | 11 | 11 | 5 | 7 | 9 | 9 | 7 |
L2 | Packers | 8 | 5 | 5 | 8 | 8 | 8 | 8 | 4 | 5 |
|
| 4 | 10 | 6 | 4 | 9 | 9 | 9 | 11 | 13 |
Check the data you have entered and correct any errors you may find.
The data shown above reflects the number of wins for the Chicago Bears and Green Bay Packers in each season since 1978 when the NFL went to a 16 game season. The only season left out was the 1982 strike shortened season. Test the alternate hypothesis that "da Bears" are a better (on the average won more games) football team than the Packers during these recent years. Each won one Super Bowl during this time. The null hypothesis would be that "da Bears" are merely equal to the Packers.
Set up the statistical test by pressing 2ndF ![]()
![]() QUIT
QUIT ![]()
![]() STAT , touching E TEST, and double touching 04 Ttest2samp. The
STAT , touching E TEST, and double touching 04 Ttest2samp. The
Set the alternate hypothesis to µ1 > µ2 by pressing | ▼ ▼ | |
standard deviations in the calculation by pressing | ▼ | ▼ |
ENTER . Pool the
ENTER . We pool
the standard deviations for the statistical test when the standard deviations are approximately equal. Statistical analysis of each data set showed they were nearly the same. Do not pool the standard deviations when they are subjectively
unequal. Set the List1 to L1 by pressing ▼ L2 by pressing 2ndF ![]()
![]() L2
L2 ![]()
![]() ENTER .
ENTER .
2ndF
L1 ![]()
![]() ENTER . Set List2 to
ENTER . Set List2 to
