Using Blackline Master 9.2
To find the ![]()
![]()
+–
⋅ ![]()
![]() ⎟
⎟
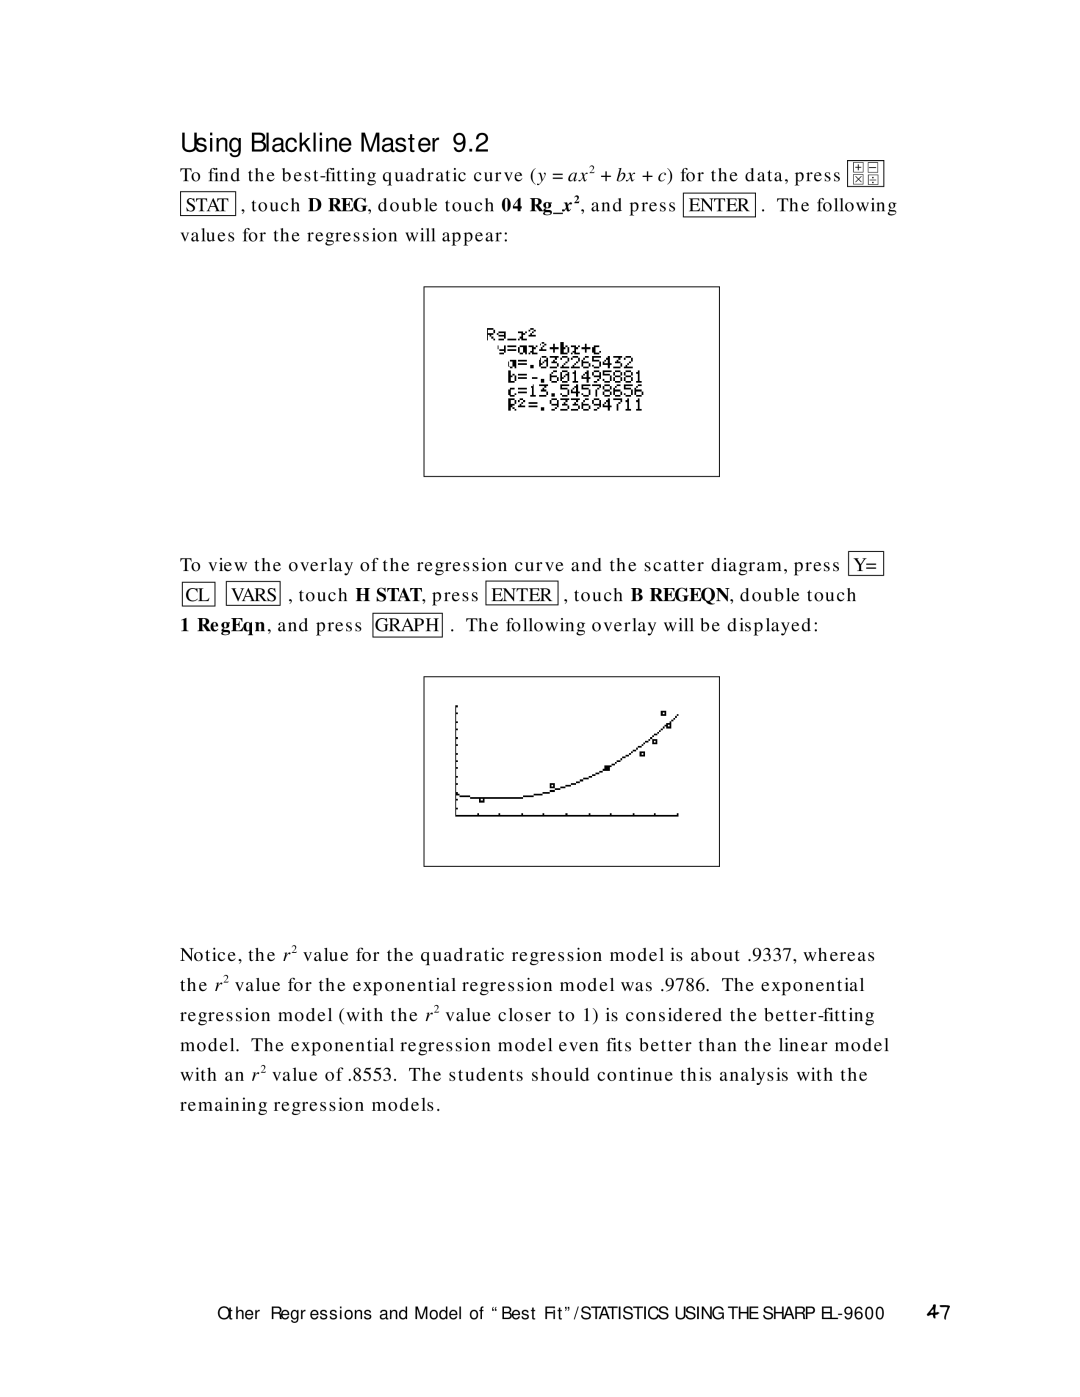
STAT , touch D REG, double touch 04 Rg_x2, and press ENTER . The following values for the regression will appear:
To view the overlay of the regression curve and the scatter diagram, press Y= CL ![]()
![]() VARS , touch H STAT, press ENTER , touch B REGEQN, double touch
VARS , touch H STAT, press ENTER , touch B REGEQN, double touch
1 RegEqn, and press GRAPH . The following overlay will be displayed:
Notice, the r 2 value for the quadratic regression model is about .9337, whereas the r 2 value for the exponential regression model was .9786. The exponential regression model (with the r 2 value closer to 1) is considered the
Other Regressions and Model of “Best Fit”/STATISTICS USING THE SHARP | 47 |