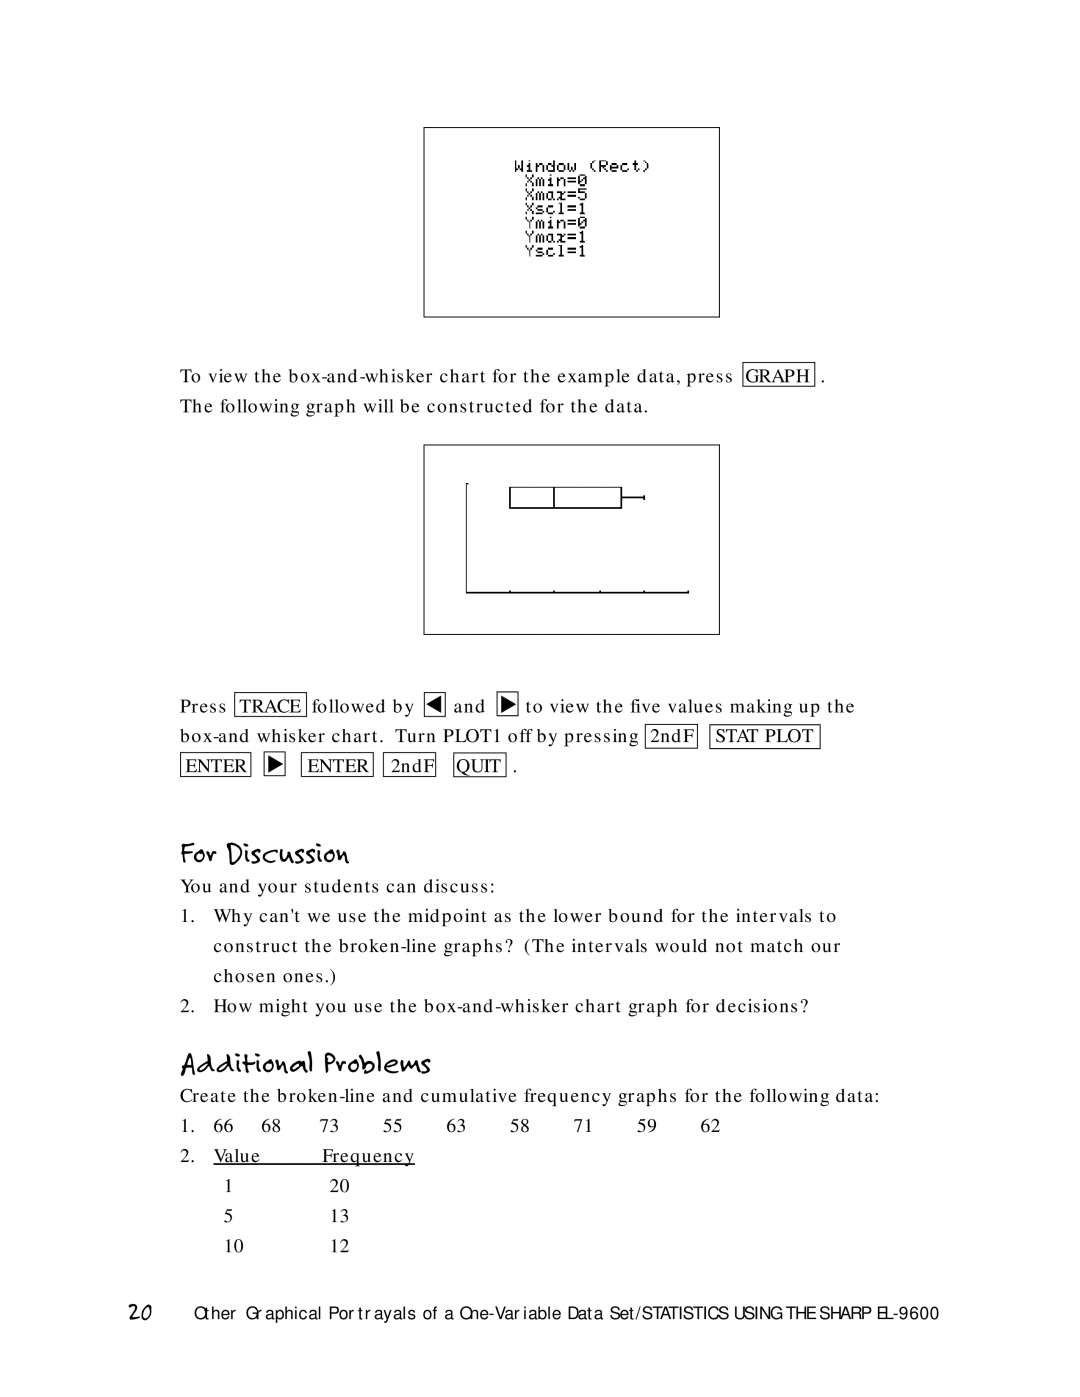
To view the
Press TRACE followed by
▼
and
▼
to view the five values making up the
STAT PLOT
ENTER
![]()
![]() ▼
▼![]()
![]()
ENTER 
 2ndF
2ndF
QUIT .
For Discussion
You and your students can discuss:
1.Why can't we use the midpoint as the lower bound for the intervals to construct the
2.How might you use the
Additional Problems
Create the
1. | 66 | 68 | 73 | 55 | 63 | 58 | 71 | 59 | 62 |
2. | Value |
| Frequency |
|
|
|
|
| |
| 1 |
| 20 |
|
|
|
|
|
|
513
1012
20Other Graphical Portrayals of a