NAME _____________________________________________________ CLASS __________ DATE __________
10.2
STATISTICAL TESTS
Steps for performing a
1. Access the data entry screen and enter the additional data for L2. |
| |||||||
(Use the Bears data from 10.1): |
|
|
|
|
|
| ||
L2 Packers 8 | 5 | 5 | 8 | 8 | 8 | 8 | 4 | 5 |
4 | 10 | 6 | 4 | 9 | 9 | 9 | 11 | 13 |
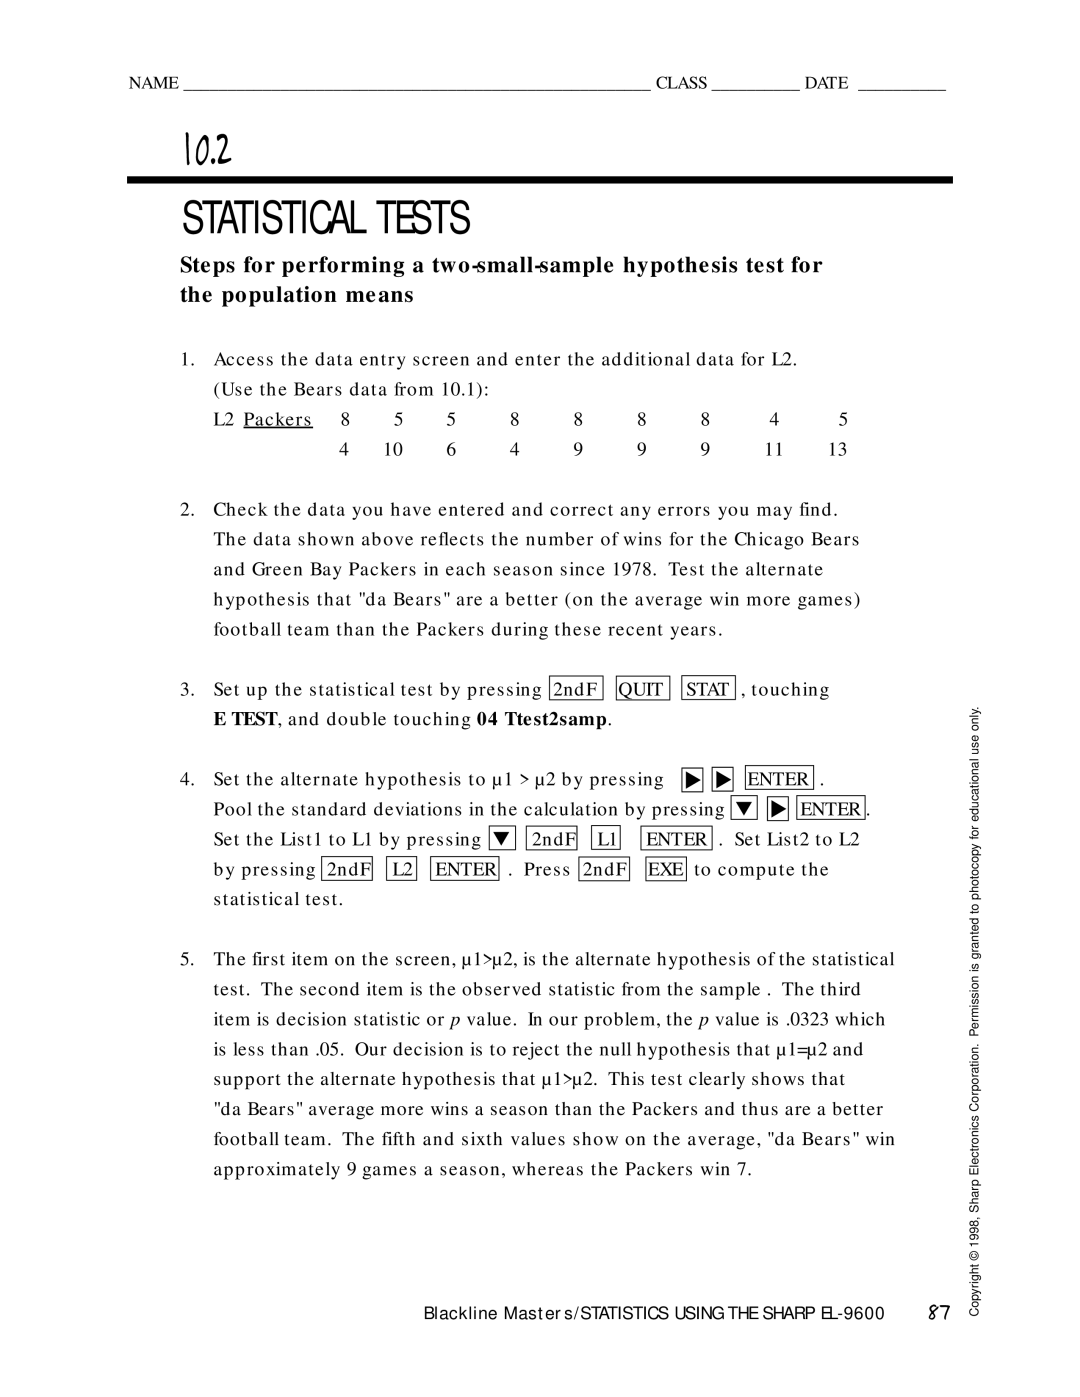
2.Check the data you have entered and correct any errors you may find. The data shown above reflects the number of wins for the Chicago Bears and Green Bay Packers in each season since 1978. Test the alternate hypothesis that "da Bears" are a better (on the average win more games) football team than the Packers during these recent years.
3. | Set up the statistical test by pressing | 2ndF |
|
| QUIT |
|
| STAT | , touching | ||||||||||||||||||||
| E TEST, and double touching 04 Ttest2samp. |
|
|
|
|
|
|
|
|
|
|
|
| ||||||||||||||||
|
|
|
|
|
|
|
|
|
|
|
|
|
|
|
|
|
|
|
|
|
|
|
| ||||||
4. | Set the alternate hypothesis to µ1 > µ2 by pressing | ▼ ▼ |
| ENTER | . |
| |||||||||||||||||||||||
|
|
|
|
|
|
|
|
|
|
|
|
|
|
|
|
|
|
|
|
|
| ||||||||
| Pool the standard deviations in the calculation by pressing | ▼ | ▼ | ENTER | . | ||||||||||||||||||||||||
|
|
|
|
|
|
|
|
|
|
|
|
|
|
|
|
|
|
|
|
| |||||||||
| Set the List1 to L1 by pressing ▼ | 2ndF |
|
| L1 |
|
|
| ENTER | . Set List2 to L2 | |||||||||||||||||||
|
|
|
|
|
|
|
|
|
|
|
|
|
|
|
|
|
|
|
| ||||||||||
| by pressing | 2ndF |
| L2 |
| ENTER | . Press | 2ndF |
|
| EXE | to compute the | |||||||||||||||||
| statistical test. |
|
|
|
|
|
|
|
|
|
|
|
|
|
|
|
|
|
|
|
| ||||||||
5.The first item on the screen, µ1>µ2, is the alternate hypothesis of the statistical test. The second item is the observed statistic from the sample . The third item is decision statistic or p value. In our problem, the p value is .0323 which is less than .05. Our decision is to reject the null hypothesis that µ1=µ2 and support the alternate hypothesis that µ1>µ2. This test clearly shows that
"da Bears" average more wins a season than the Packers and thus are a better football team. The fifth and sixth values show on the average, "da Bears" win approximately 9 games a season, whereas the Packers win 7.
Blackline Masters/STATISTICS USING THE SHARP | 87 |
Copyright © 1998, Sharp Electronics Corporation. Permission is granted to photocopy for educational use only.
