Chapter 3 | Menus |
3.1Main Menu
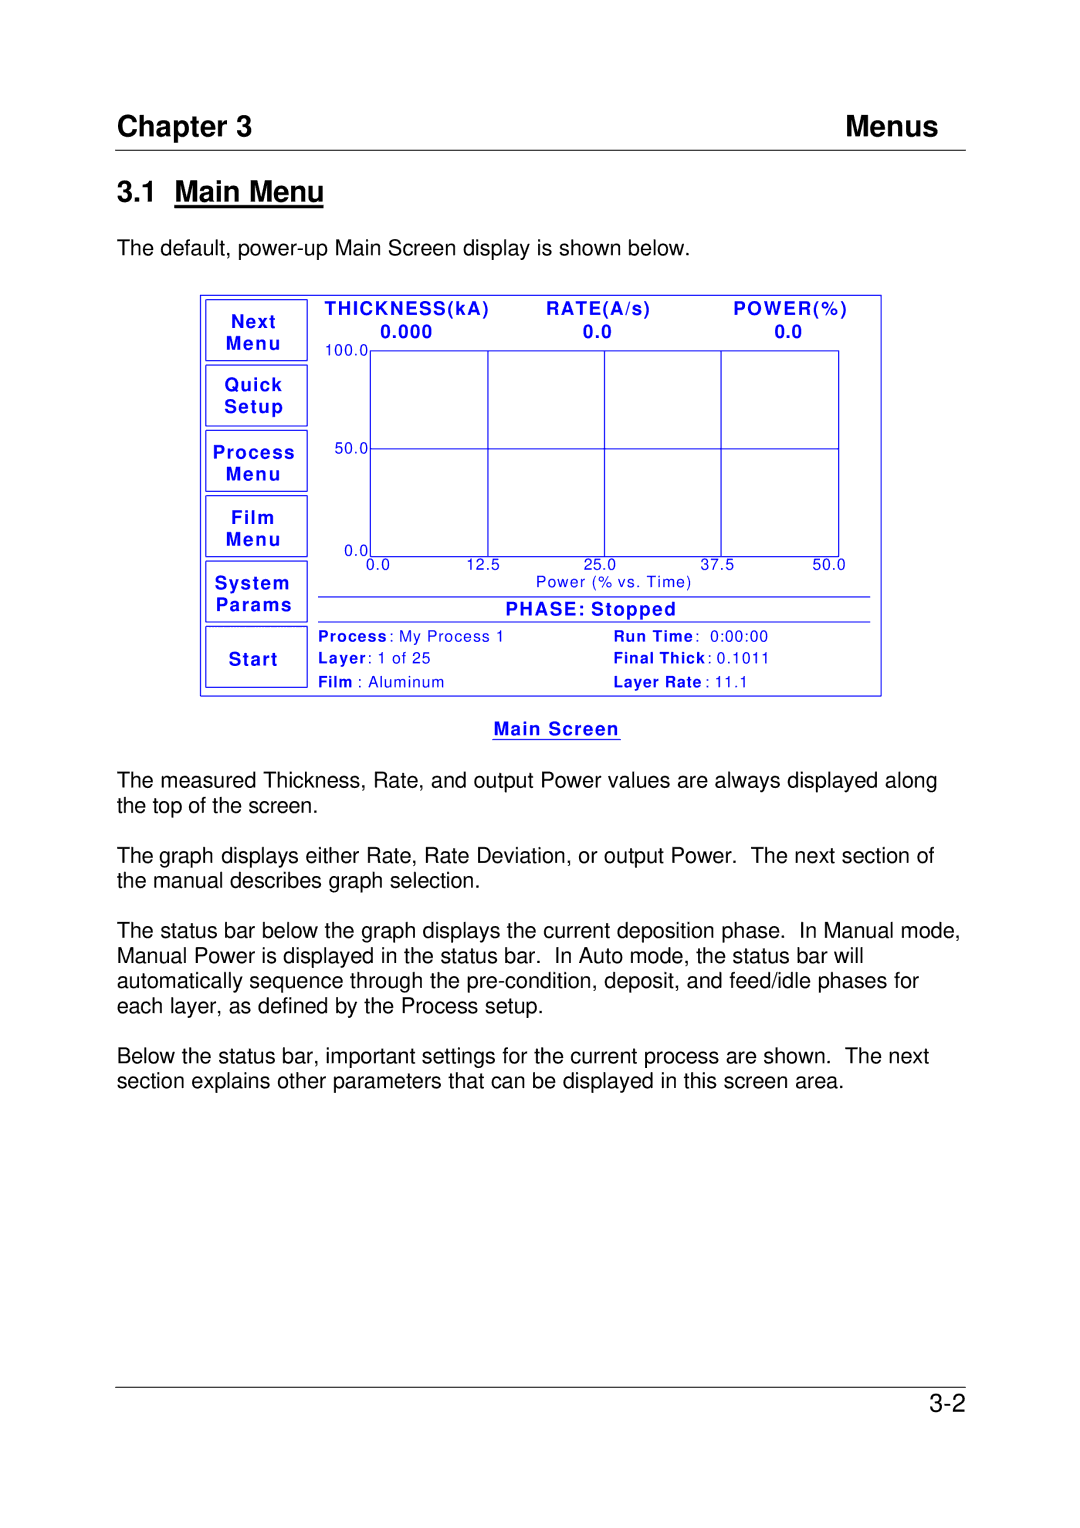
The default, power-up Main Screen display is shown below.
Next Menu
Quick Setup
THICKNESS(kA) | RATE(A/s) | P O W E R (% ) | ||
0.000 | 0.0 | 0.0 |
| |
100.0 |
|
|
|
|
|
|
|
| |
Process
Menu
Film
Menu
System Params
Start
50.0
0.0
0.0 | 12.5 | 25.0 | 37.5 | 50.0 |
|
| Power (% vs. Time) |
|
|
|
|
|
|
|
|
| PHASE: Stopped |
|
|
Process : My Process 1 | Run Time : 0:00:00 |
| ||
Layer: 1 of 25 |
| Final Thick : 0.1011 |
| |
Film : Aluminum |
| Layer Rate : 11.1 |
| |
Main Screen
The measured Thickness, Rate, and output Power values are always displayed along the top of the screen.
The graph displays either Rate, Rate Deviation, or output Power. The next section of the manual describes graph selection.
The status bar below the graph displays the current deposition phase. In Manual mode, Manual Power is displayed in the status bar. In Auto mode, the status bar will automatically sequence through the
Below the status bar, important settings for the current process are shown. The next section explains other parameters that can be displayed in this screen area.