N9340A specifications
Agilent Technologies, now part of Keysight Technologies, has established itself as a leader in electronic measurement solutions. One of their standout products, the N9340A Portable Spectrum Analyzer, exemplifies cutting-edge technology tailored for a diverse range of applications in the field of RF and microwave engineering.The Agilent N9340A is a compact, lightweight, and battery-operated spectrum analyzer that is designed to meet the rigorous demands of both field and laboratory environments. Weighing merely 3.1 kg (6.8 lbs), it boasts a rugged design that ensures durability during portable use, making it a preferred choice for technicians and engineers who require mobility without sacrificing performance.
One of the key features of the N9340A is its frequency range, which spans from 100 kHz up to 3 GHz, allowing users to analyze a broad array of signals across various applications, including wireless communications, broadcasting, and other RF technologies. Its exceptional sensitivity, characterized by a displayed average noise level (DANL) as low as -165 dBm, makes it capable of detecting even the faintest signals amidst noise.
The instrument is equipped with a user-friendly interface, featuring a large 8.4-inch display that offers clear and detailed visibility of spectra and analysis results. The intuitive touch screen and enhanced graphical capabilities facilitate ease of use, especially in fast-paced testing environments.
Moreover, the N9340A incorporates advanced measurement capabilities, such as a real-time measurement option, which allows for instantaneous signal analytics. This feature is particularly valuable for applications in the fields of signal interference identification and troubleshooting. The analyzer also supports various analysis modes, including power spectral density, vector signal analysis, and channel power measurement, catering to diverse measurement needs.
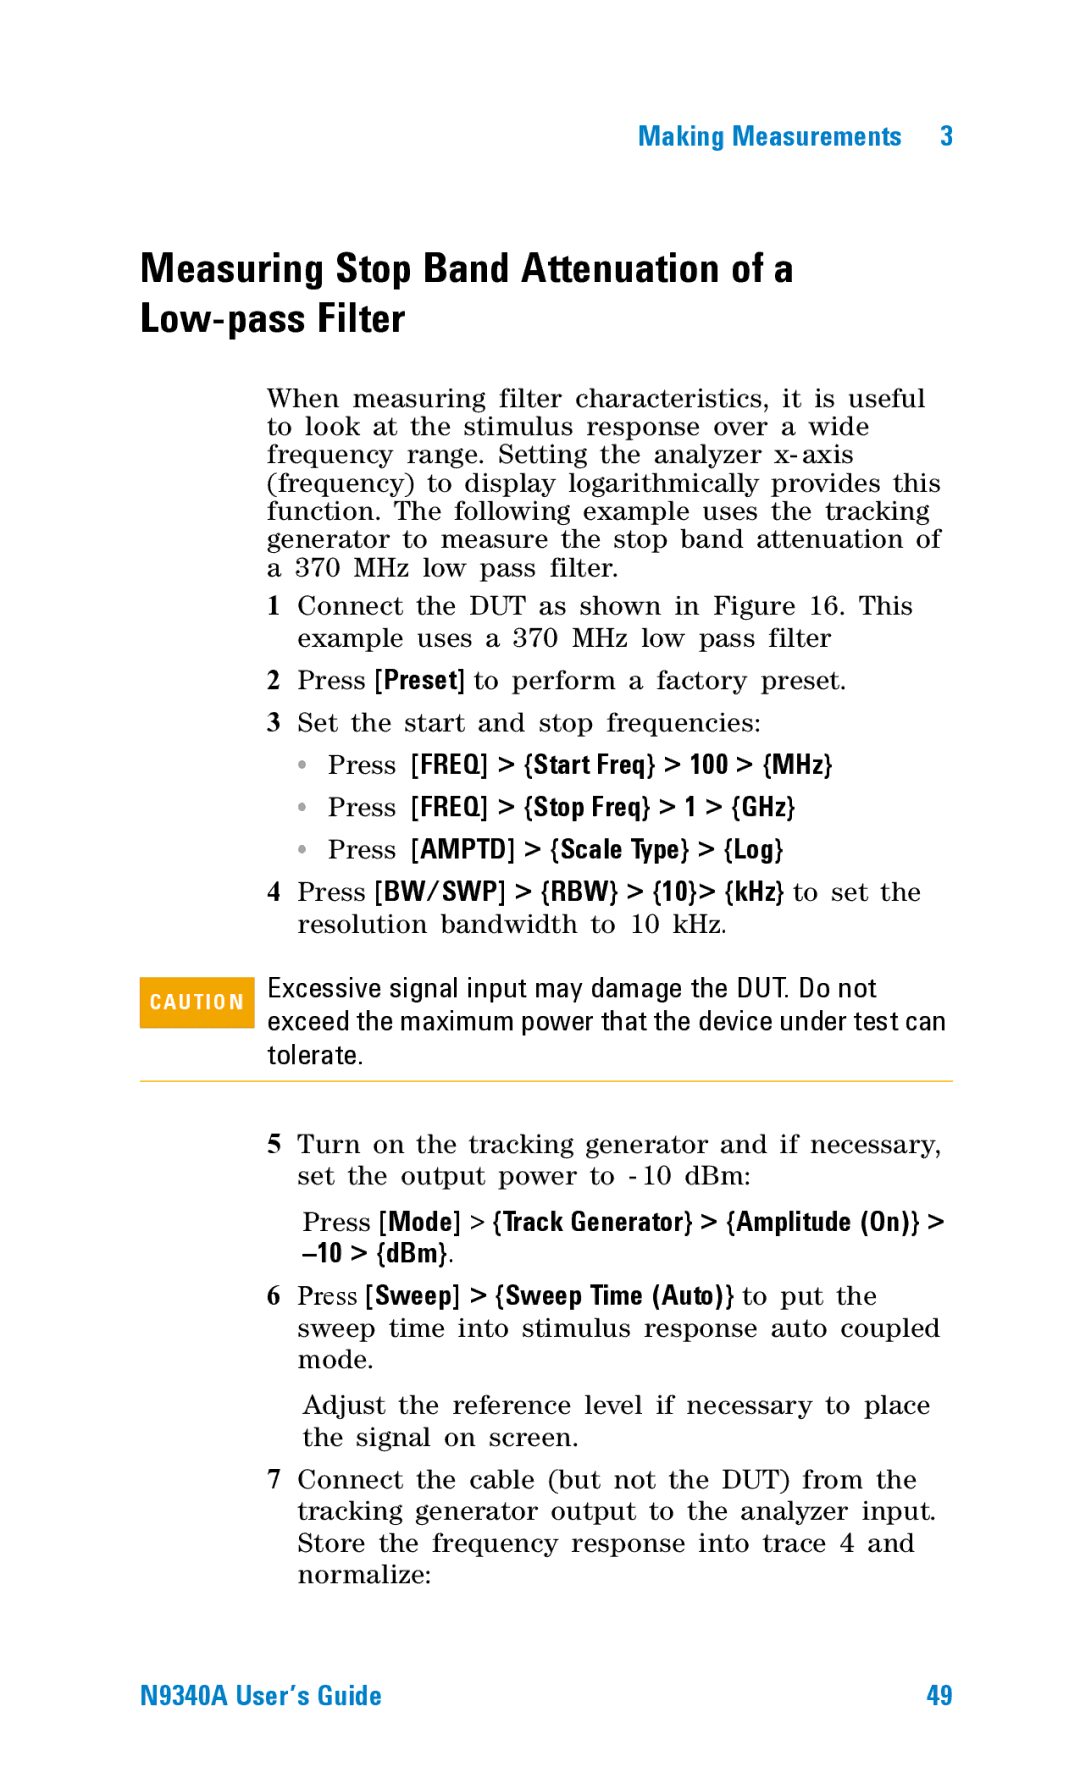
A notable technological advancement in the N9340A is its built-in tracking generator, which provides a comprehensive test solution for components by enabling users to perform gain compression tests, return loss measurements, and other essential tests without the need for additional equipment.
In terms of connectivity, the N9340A offers multiple options, including USB and LAN interfaces, which aid in easy data transfer and remote operation. The optional battery pack further enhances its portability, providing users with flexibility and the ability to conduct measurements in locations without immediate access to power.
Overall, the Agilent N9340A Portable Spectrum Analyzer represents a powerful combination of advanced technology, robust performance, and practical design. Its versatility makes it an essential tool for engineers and technicians who work with RF and microwave technologies, ensuring accurate measurements and efficient workflow in an ever-evolving industry.
