|
|
|
|
|
| STRENGTH 4 |
|
|
|
| |
|
|
|
|
|
| (VDD_IO = 2.5V) |
|
|
|
| |
| 25 |
|
|
|
|
|
|
|
|
|
|
(ns) |
|
|
|
|
|
|
|
|
|
|
|
TIMES | 20 |
|
|
|
|
|
|
|
|
|
|
|
|
|
|
|
|
|
|
|
|
| |
ANDFALL | 15 |
|
|
|
|
|
|
|
|
|
|
|
|
|
|
|
|
|
|
|
|
| |
RISE | 10 |
|
|
|
|
|
|
|
|
|
|
|
|
|
| FALL TIME |
|
|
|
| |||
|
|
|
|
| Y = 0.0592x + 1.0629 |
|
|
|
| ||
| 5 |
|
|
|
|
|
|
|
|
|
|
|
|
|
|
|
|
|
|
| RISE TIME | ||
|
|
|
|
|
|
|
|
| Y = 0.0573x + 0.9789 | ||
| 0 | 10 | 20 | 30 | 40 | 50 | 60 | 70 | 80 | 90 | 100 |
| 0 | ||||||||||
|
|
|
| LOAD CAPACITANCE (pF) |
|
| |||||
Figure 41. Typical Output Rise and Fall Time (10% to 90%, VDD_IO = 2.5 V) vs. Load Capacitance at Strength 4
|
|
|
|
|
| STRENGTH 5 |
|
|
|
| |
|
|
|
|
|
| (VDD_IO = 2.5V) |
|
|
| ||
| 25 |
|
|
|
|
|
|
|
|
|
|
(ns) | 20 |
|
|
|
|
|
|
|
|
|
|
TIMES |
|
|
|
|
|
|
|
|
|
| |
|
|
|
|
|
|
|
|
|
|
| |
FALLAND | 15 |
|
|
|
|
|
|
|
|
|
|
|
|
|
|
|
|
|
|
|
|
| |
RISE | 10 |
|
|
|
|
|
|
|
|
|
|
|
|
|
| FALL TIME |
|
|
|
| |||
|
|
|
|
| Y = 0.0493x + 0.8389 |
|
|
| |||
| 5 |
|
|
|
|
|
|
|
|
|
|
|
|
|
|
|
|
|
|
| RISE TIME | ||
| 0 |
|
|
|
|
|
| Y = 0.0481x + 0.7889 | |||
| 10 | 20 | 30 | 40 | 50 | 60 | 70 | 80 | 90 | 100 | |
| 0 | ||||||||||
|
|
|
| LOAD CAPACITANCE (pF) |
|
|
| ||||
Figure 42. Typical Output Rise and Fall Time (10% to 90%, VDD_IO = 2.5 V) vs. Load Capacitance at Strength 5
|
|
|
|
|
|
|
|
|
|
|
|
| STRENGTH 6 |
|
|
| |||
|
|
|
|
|
|
|
|
|
|
| 25 | (VDD_IO = 2.5V) |
|
|
| ||||
(ns) |
|
|
|
|
|
|
|
| |
|
|
|
|
|
|
|
| ||
|
|
|
|
|
|
|
|
| |
|
|
|
|
|
|
|
|
| |
TIMES | 20 |
|
|
|
|
|
|
|
|
FALLAND | 15 |
|
|
|
|
|
|
|
|
RISE |
|
|
|
|
|
|
|
| |
10 |
|
|
|
|
|
|
|
| |
|
|
|
|
| RISE | TIME |
| ||
|
|
|
|
|
|
|
|
| |
|
| FALL TIME |
|
| Y = 0.0377x + 0.7449 | |||||
5 |
|
|
|
|
|
|
| |||
| Y = 0.0374x + 0.851 |
|
|
|
|
|
| |||
|
|
|
|
|
|
|
| |||
0 | 10 | 20 | 30 | 40 | 50 | 60 | 70 | 80 | 90 | 100 |
0 | ||||||||||
|
|
| LOAD CAPACITANCE (pF) |
|
|
| ||||
Figure 43. Typical Output Rise and Fall Time (10% to 90%, VDD_IO = 2.5 V) vs. Load Capacitance at Strength 6
ADSP-TS201S
|
|
|
|
|
|
|
|
|
|
|
|
| STRENGTH 7 |
|
|
|
| ||
| 25 |
| (VDD_IO = 2.5V) |
|
|
| |||
(ns) |
|
|
|
|
|
|
|
| |
|
|
|
|
|
|
|
| ||
|
|
|
|
|
|
|
|
| |
|
|
|
|
|
|
|
|
| |
TIMES | 20 |
|
|
|
|
|
|
|
|
FALLAND | 15 |
|
|
|
|
|
|
|
|
|
|
|
|
|
|
|
|
| |
RISE | 10 |
|
|
|
|
|
|
|
|
|
|
|
|
|
|
|
| ||
|
|
|
|
|
|
|
| ||
|
|
|
|
|
| RISE TIME | |||
|
|
|
|
|
|
| |||
|
| FALL TIME |
|
| Y = 0.0321x + 0.6512 | |||||
5 |
|
|
|
|
|
|
| |||
| Y = 0.0313x + 0.818 |
|
|
|
|
|
| |||
|
|
|
|
|
|
|
| |||
0 | 10 | 20 | 30 | 40 | 50 | 60 | 70 | 80 | 90 | 100 |
0 | ||||||||||
|
|
| LOAD CAPACITANCE (pF) |
|
|
| ||||
Figure 44. Typical Output Rise and Fall Time (10% to 90%, VDD_IO = 2.5 V) vs. Load Capacitance at Strength 7
| 15 |
|
|
| STRENGTH |
|
| 0 | |||
|
|
|
|
|
| (VDD_IO = 2.5V) |
|
|
|
| |
(ns) | 10 |
|
|
|
|
|
|
|
|
|
|
VALID |
|
|
|
|
|
|
|
|
|
| 1 |
OUTPUT |
|
|
|
|
|
|
|
|
|
| |
|
|
|
|
|
|
|
|
|
| 2 | |
5 |
|
|
|
|
|
|
|
|
| 3 | |
|
|
|
|
|
|
|
|
| 4 | ||
|
|
|
|
|
|
|
|
|
| ||
|
|
|
|
|
|
|
|
|
|
| |
|
|
|
|
|
|
|
|
|
|
| 5 |
|
|
|
|
|
|
|
|
|
|
| 6 |
|
|
|
|
|
|
|
|
|
|
| 7 |
| 0 |
|
|
|
|
|
|
|
|
|
|
| 0 | 10 | 20 | 30 | 40 | 50 | 60 | 70 | 80 | 90 | 100 |
|
|
|
| LOAD CAPACITANCE (pF) |
|
|
| ||||
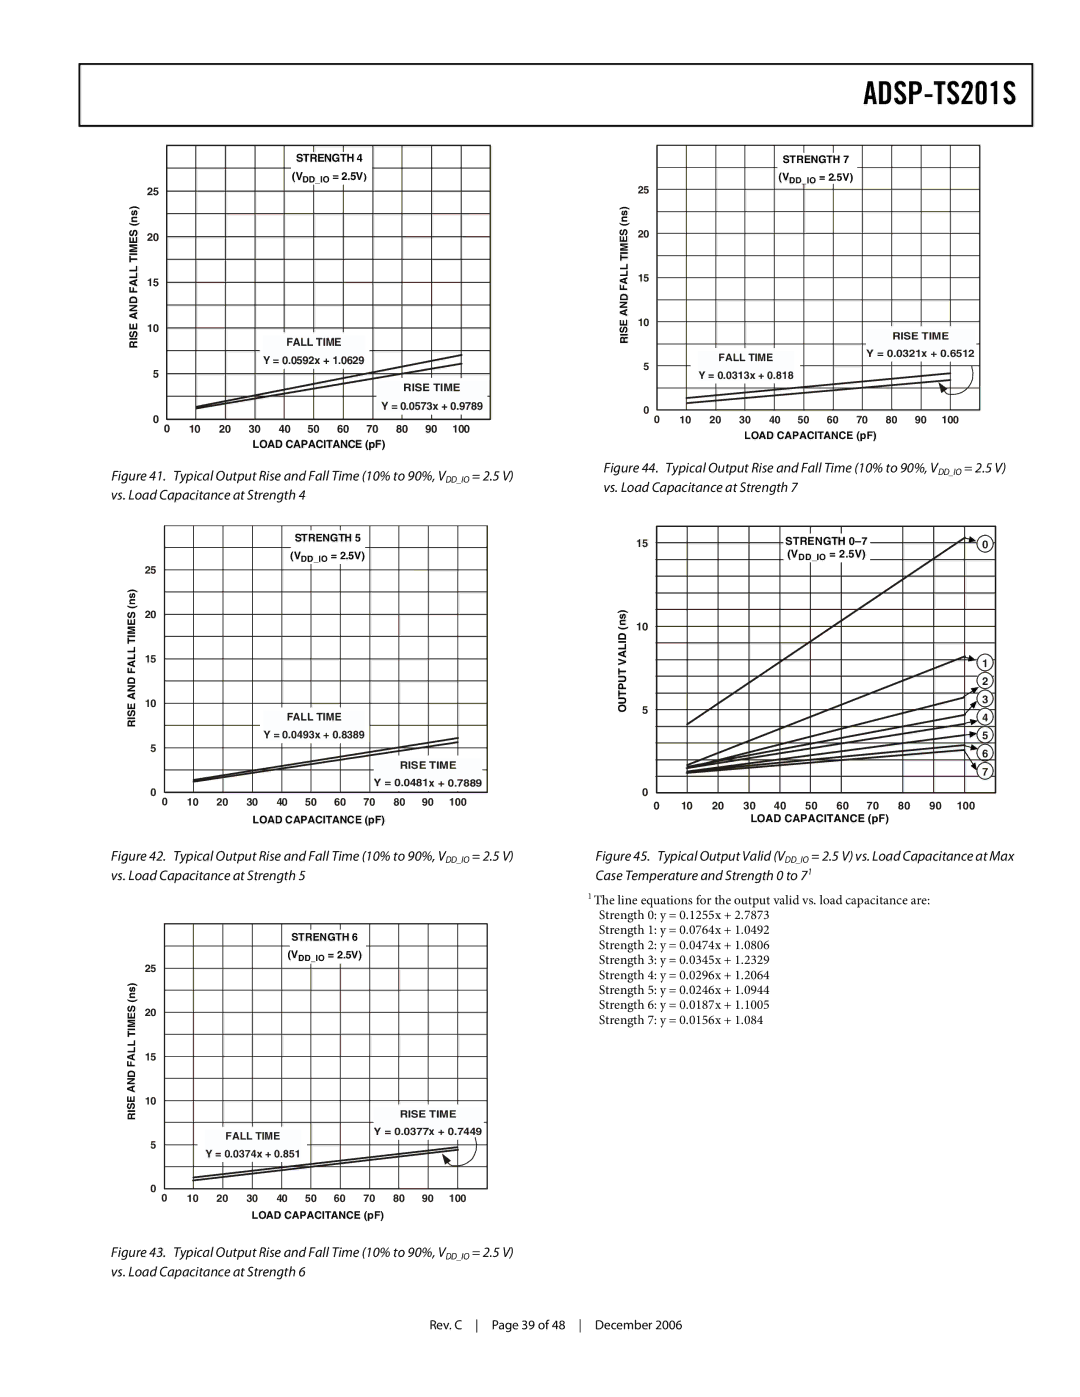
Figure 45. Typical Output Valid (VDD_IO = 2.5 V) vs. Load Capacitance at Max Case Temperature and Strength 0 to 71
1The line equations for the output valid vs. load capacitance are: Strength 0: y = 0.1255x + 2.7873
Strength 1: y = 0.0764x + 1.0492
Strength 2: y = 0.0474x + 1.0806
Strength 3: y = 0.0345x + 1.2329
Strength 4: y = 0.0296x + 1.2064
Strength 5: y = 0.0246x + 1.0944
Strength 6: y = 0.0187x + 1.1005
Strength 7: y = 0.0156x + 1.084
Rev. C Page 39 of 48 December 2006