Chapter 4 Connecting the Cisco uBR7225VXR Router to the Cable Headend
Measuring the Upstream RF Signal
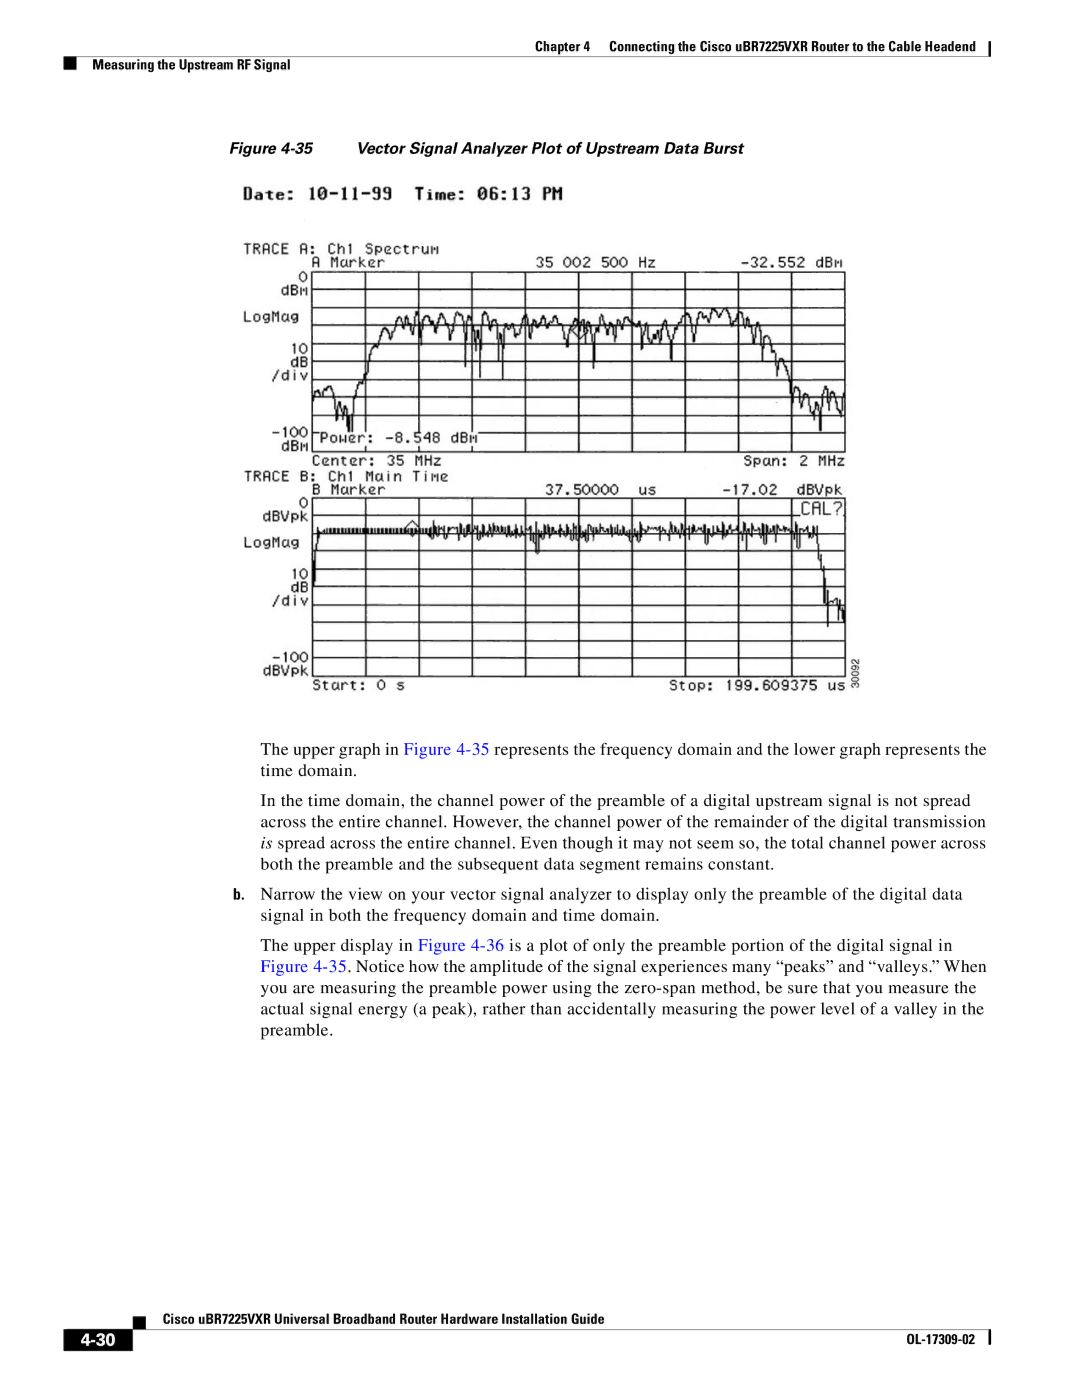
Figure 4-35 Vector Signal Analyzer Plot of Upstream Data Burst
The upper graph in Figure
In the time domain, the channel power of the preamble of a digital upstream signal is not spread across the entire channel. However, the channel power of the remainder of the digital transmission is spread across the entire channel. Even though it may not seem so, the total channel power across both the preamble and the subsequent data segment remains constant.
b.Narrow the view on your vector signal analyzer to display only the preamble of the digital data signal in both the frequency domain and time domain.
The upper display in Figure
| Cisco uBR7225VXR Universal Broadband Router Hardware Installation Guide |
|