Text Part Number OL-17309-02
Americas Headquarters
Page
N T E N T S
AC Power
Measuring the Downstream RF Signal at the Upconverter Output
Maintaining the Cisco uBR7225VXR Router
Coaxial Cables C-1
Viii
Document Revision History
Preface
Document Objectives
Revision Date Change Summary
Chapter Title Description
Audience
Document Organization
Appendix G, Site Log
Document Conventions
Obtaining Documentation and Submitting a Service Request
Cisco uBR7225VXR Universal Broadband Router
Cisco uBR7225VXR Overview
OL-17309-02
Cable interface line card slot
Cisco uBR7225VXR Router Chassis
Card Slot and Logical Interface Numbering
Cisco uBR7225VXR Network Interface Overview
Cisco uBR7255VXR Chassis and Cable Interface Line Cards
MAC-Layer Address
Basic Internet Access Services
Supported System Configurations Overview
Two-Way HFC Cable Network Example
IP Telephony Services
VPN Services
HFC
Telco Return
Network Processing Engine
Hardware Component Descriptions
NPE Comparisons
Cisco Cable Interface Line Cards
Power Supplies
Fan Trays
Cisco uBR7225VXR AC-Input Power Supply
Cisco uBR7225VXR Fan Tray
Internal Airflow-Top View
Subchassis and Midplane
Cisco uBR7225VXR Chassis
Top Back
CompactFlash Disk
Cisco uBR7225VXR Overview Hardware Component Descriptions
OL-17309-02
Safety Recommendations
Installation
Lifting the Cisco uBR7225VXR Router Safely
Lifting the Chassis Cisco uBR7246 Router Shown
Safety with Electricity
Preventing Electrostatic Discharge Damage
Site Environment
AC Power
Site Requirements
Specification Minimum Maximum
Site Configuration Maintaining Normal Operation
General Precautions
Before You Begin
Power Considerations
Required Network Information
Rack-Mount and Cable-Management Kit
Installation Tools
Shipping Container Contents
Equipment Required to Verify Your Plant’s RF Setup
Two-Way Data and VoIP
Provisioning the Cable Headend
Receivers
Headend Certification
Diplex Filters
DHCP, DNS, TFTP, and TD Servers
Dial-Up/Remote Access Servers
VoIP Sgcp Pass-Through
Authentication, Authorization, and Accounting Servers
VoIP Gateways and Gatekeepers
Interference Considerations
Headend Wiring
Equipment Racks
17.32 23.875 21.875
Task Verified By Date
Site Preparation Checklist
Task Verified By Date
Component Checklists
Cisco uBR7225VXR Router Installation Checklist
Installing the Cisco uBR7225VXR Router
Cisco uBR7225VXR Router Chassis Rack-Mounting Options
Typical 4-Post Equipment Rack Posts and Mounting Strips
Rack-mount bracket
Cable-Management Bracket Requirements
Installing the Chassis in a Telco-Type Rack
Rack-mount bracket Cable-management bracket
Installing Rack-Mount Brackets on the Rear of the Chassis
Installing the Brackets on the Chassis
Installing Rack-Mount Brackets on the Front of the Chassis
Installing Rack-Mount Brackets in the Middle of the Chassis
Installing the Chassis in the Rack
OL-17309-02
OL-17309-02
Cabling
Console and Auxiliary Port Connection Equipment
Connecting Cable Interface Line Card Cables
Pin Signal Direction Description
Console Port Signals
Auxiliary Port Signals
Protective Grounding
Connecting Power
Connecting to the AC-Input Power Supply
14 Connecting AC-Input Power
Powering On the Cisco uBR7225VXR Router
Configuring the Interfaces
OL-17309-02
Connecting the Cisco uBR7225VXR Router to the Cable Headend
Two-Way Data Headend Architecture
RF and Digital Data Overview
One-Way Data Headend Architecture
Installing and Configuring the Upconverter
Connecting and Configuring the Downstream
Measuring the Downstream RF Signal
Page
Viewing the Downstream if Signal on a Spectrum Analyzer
Measuring the Downstream RF Signal at the Upconverter Output
Overloaded Spectrum Analyzer Input
Page
OL-17309-02
OL-17309-02
OL-17309-02
OL-17309-02
OL-17309-02
OL-17309-02
OL-17309-02
OL-17309-02
Connecting the Upstream to the Optical Receiver
Connecting and Configuring the Upstream
Docsis Specification
Channel Bandwidth Cisco MC11 Fpga
30 km Fiber node Milliwatt Measure +10 dBmV at this point
Testing the Upstream Configuration
Optical receiver
Downstream Optical +10 dBmV Receiver +13 dBmV Attenuator
Measuring the Upstream RF Signal Using a Spectrum Analyzer
Measuring the Upstream RF Signal
OL-17309-02
OL-17309-02
29 Analyzing the Upstream RF Signal-64-Byte Data Packets
Analyzing the Upstream RF Signal
30 Analyzing the Upstream RF Signal-1500-Byte Data Packets
OL-17309-02
Symbol Rate +/-1/2 Symbol Rate Bandwidth
Using the Zero-Span Method with Adjacent Upstream Channels
Center Frequency Minimum Resolution
OL-17309-02
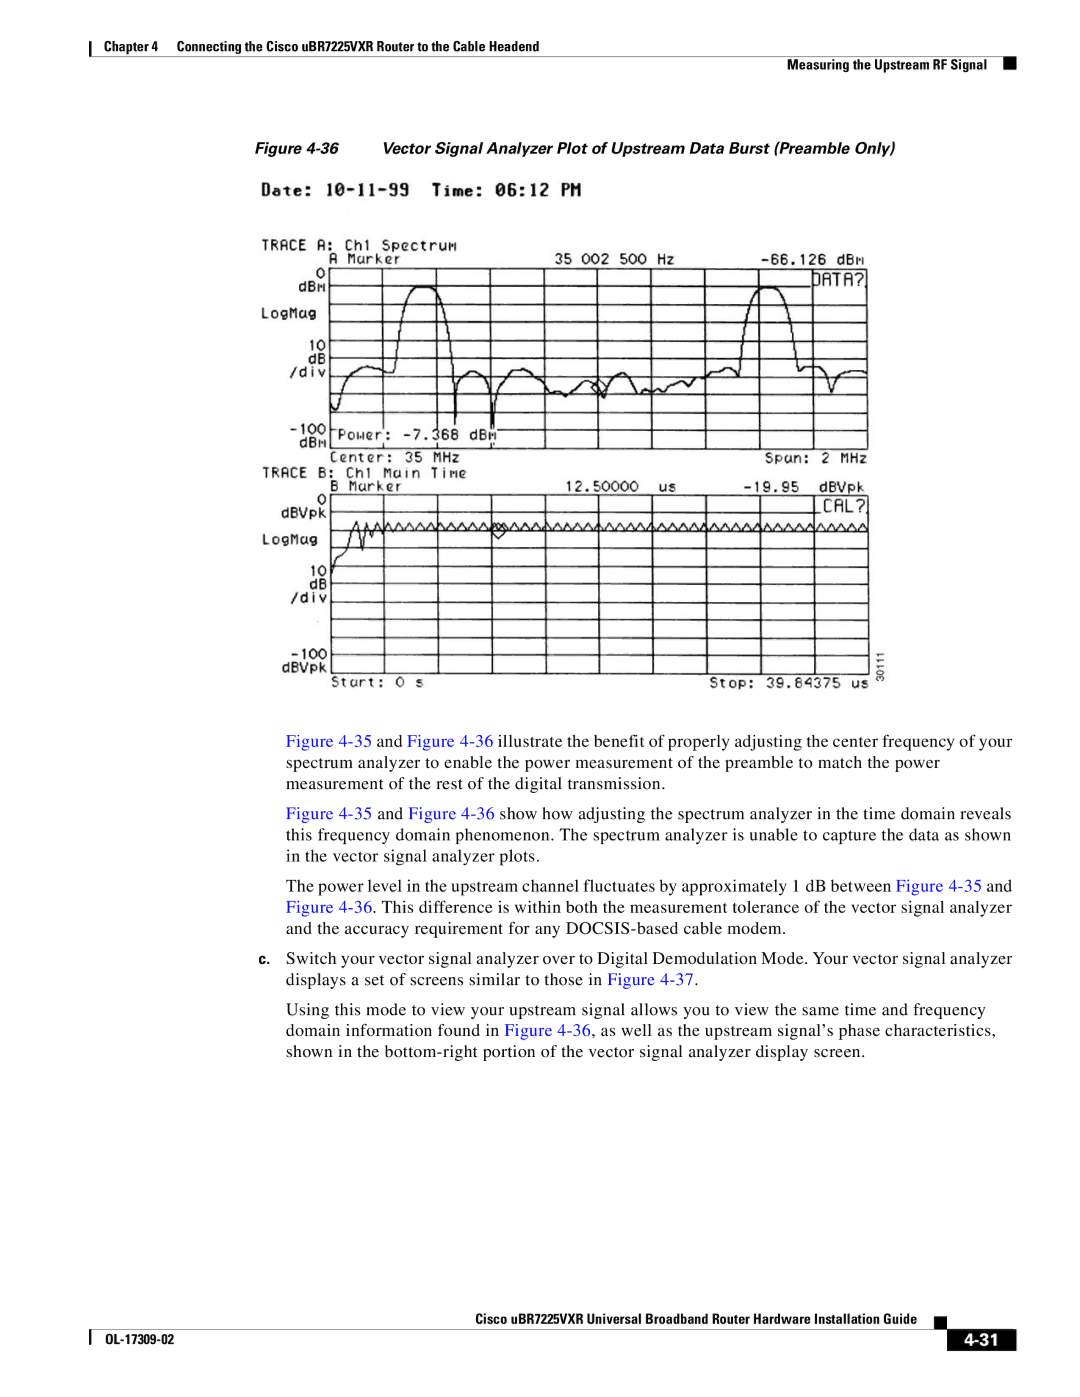
35 Vector Signal Analyzer Plot of Upstream Data Burst
OL-17309-02
OL-17309-02
OL-17309-02
39 Preamble Amplitude Before Center Frequency Adjustment
41 Original Preamble Viewed with Accelerated Sweep Time
OL-17309-02
Connecting the Cisco uBR7225VXR Router to the Cable Headend
OL-17309-02
Connecting the Cisco uBR7225VXR Router to the Cable Headend
Configuring the Digital Signal
OL-17309-02
OL-17309-02
Online Insertion and Removal
Maintaining the Cisco uBR7225VXR Router
Environmental Monitoring
Environmental Monitoring and Reporting Functions
Parameter High Warning High Critical Shutdown
Reporting Functions
Router# show environment
Temperature ranges and values are subject to change
Fan Failures
Providing Information
Troubleshooting
Overview
Troubleshooting Problem Solving with Subsystems
Problem Solving with Subsystems
Identifying Startup Problems
Cooling Subsystem
Power Subsystem
Processor Subsystem
Troubleshooting the Network Processing Engine
Troubleshooting Cable Interface Line Cards
Other Troubleshooting Information Websites
Verifying the Downstream Signal
Troubleshooting Verifying the Downstream Signal
Description Specification
Cisco uBR7225VXR Router Specifications
Broadband Routers at the following URL
Channel Symbol Rate Raw Data Rate Nominal Data
RF Specifications
Bandwidth, MHz Msym/sec Mbps Rate, Mbps
Channel Qpsk Raw
Parameter Value
Docsis 1.0 Transmission Characteristics
Downstream RF Channel Transmission Characteristics
Upstream RF Channel Transmission Characteristics
Docsis 1.1 Transmission Characteristics
EuroDOCSIS Transmission Characteristics
Downstream RF Channel Transmission Characteristics
Upstream RF Channel Transmission Characteristics
Electrical Input and Output
Parameter Value
OL-17309-02
Coaxial Cables
Cable Specifications
Identifying an RJ-45 Rollover Cable
Console and Auxiliary Port Cables and Pinouts
RJ-45-to-DB-9
Console Port Cables and Pinouts
Identifying an RJ-45 Crossover Cable
Fast Ethernet Port Cables and Pinouts
Auxiliary Port Cables and Pinouts
RJ-45 Pin Description
Identifying an RJ-45 Straight-Through Cable
RJ-45 Pin
Figure C-5 Duplex SC Cable Connector
Fiber-Optic Cables and Connectors
About Wiring Standards
Industry-Standard Wiring Plans
Position Color
Optical Fiber Color Codes
TIA/EIA Standards Information
Pair Number Wire Number Solid Color Stripe Color Pin Number
Telephone Wire Color Codes
Pair Number Wire Number Solid Color Stripe Color Pin Number
White Blue Green Red Orange Black Yellow
Pair Number Wire Number Solid Color Stripe Color
OL-17309-02
Http//developer.apple.com Http//atxnetworks.com
Frequency Allocation Tables
B1, G D1, K
Standards Comparisons
Ntsc Cable Television Channels and Relative Frequencies
Freq MHz Carrier Visual Aural
Table E-4
Freq MHz Carrier Visual Aural
Table E-4
Ntsc M Cable Television Frequencies for Japan
Table E-5 Japanese Channel Assignments
Bandwidth Visual Carrier Aural Carrier
PAL/SECAM Cable Television Channels and Relative Frequencies
Channel
Channel Bandwidth Visual Carrier Aural Carrier Number MHz
Table E-6
OL-17309-02
Manufacturer Website or Phone Number Products/Model
Manufacturers for Headend Provisioning Requirements
North American Channel Plans
Agilent Agilent 89411A
European Channel Plans
Agilent Agilent 8591C Tektronix 2715 Sunrise Telecom AT2000R
Site Log
Initials
Symbols
GL-2
GL-3
GL-4
GL-5
GL-6
D E
IN-2
IN-3
IN-4
IN-5
IN-6
IN-7
IN-8