D-Link DES-3250TG Standalone Layer 2 Switch
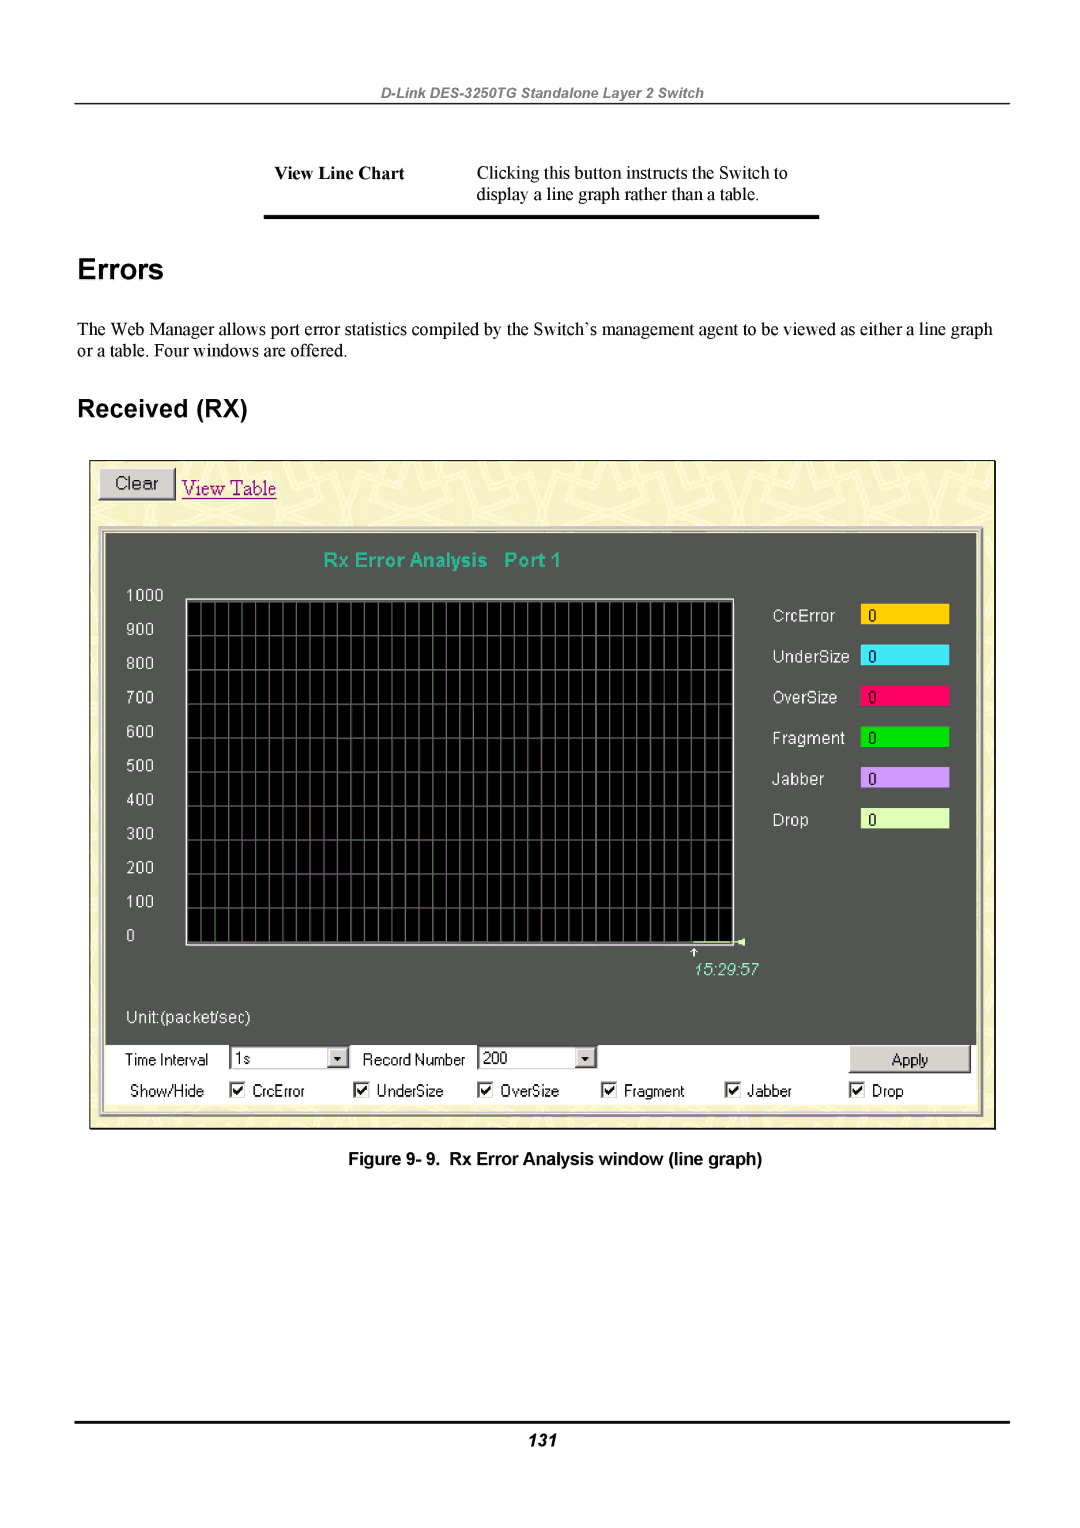
View Line Chart | Clicking this button instructs the Switch to |
| display a line graph rather than a table. |
|
|
Errors
The Web Manager allows port error statistics compiled by the Switch’s management agent to be viewed as either a line graph or a table. Four windows are offered.
