Abstract
HP OneView 1.0 User Guide
Acknowledgments
Contents
Navigating the graphical user interface
Understanding the security features of the appliance
II Planning tasks Planning your data center resources
Using the Rest APIs and other programmatic interfaces
Accessing documentation and help
Planning for configuration changes
An HP 3PAR Storage System 105
107
Managing networks and network resources 115
Managing firmware for managed devices 135
Managing power and temperature 139
Managing users and authentication 143
Managing enclosures and enclosure groups 131
Managing the appliance 153
Backing up an appliance 149
About unsupported and unmanaged hardware 165
Monitoring power and temperature 179
VI Troubleshooting 197 199
Using the State-Change Message Bus Scmb 185
Restoring an appliance from a backup file 221
Support and other resources 227
231
Using the virtual appliance console 269
Backup and restore script examples 271
Index 293
Part I Learning about HP OneView
Page
HP OneView for converged infrastructure management
Learning about HP OneView
HP OneView for converged infrastructure management
Architecture
Hardware and software provisioning features
One tool and one data set-one view
Learning about HP OneView
Expert design with consistent deployment
Hardware and software provisioning features
Server profiles
Groups, templates, and sets
Types of groups and sets
Define configurations for specific environments
Streamlined process for bringing hardware under management
Operating system deployment
Flexibility in design and deployment
Simplified firmware management
Firmware and configuration change management features
Monitoring and response features
Simplified configuration change management
Isolated management network
Automatic configuration for monitoring
Monitoring the environment and responding to issues
Monitoring and response features
Data center environmental management
Resource utilization monitoring
Alert and health management
Backup and restore features
Backup and restore features
Specialized user role for creating backup files
Recovery from catastrophic failures
Availability features
Security features
Graphical and programmatic interfaces
User interface-efficiency and simplicity by design
Rest APIs-automation and integration
Integration with other HP management software
Open integration
Convenient licensing model
Logical interconnects
Networking features
Networking features
Supported networks
Network sets
Understanding the resource model
Resource model summary diagram
UI screens and Rest API resources
Server profiles
Connection templates
Relationship to other resources
Connections and server-profiles
Connections
Server hardware types
Connection-templates
Server-hardware-types
Server hardware
Zero or more server profiles
UI screen Rest API resource Server Hardware Types
Enclosure-groups
Enclosure groups
Enclosure types
Server-hardware
Exactly one enclosure group
Zero or more power delivery devices
Enclosures
Interconnect types
Interconnect-types
Interconnects
Logical-interconnects
Logical interconnect groups
UI screen Rest API resources Interconnects
Interconnects , interconnect-types ,
Logical interconnects
UI screen Rest API resource Logical Interconnect Groups
Logical-interconnect-groups
To a downlink
Uplink sets
UI screen Rest API resource Logical Interconnects
Logical-downlinks
Uplink-sets
Networks
Network sets
Zero or one uplink set per logical interconnect
Domains
Domains
Appliance
Network-sets
Relationship to other resources
Resources related data center facilities
Data centers
Racks
Zero or more unmanaged devices
Power delivery devices
Power-devices
Unmanaged devices
Rest APIs
UI screen Rest API resource Unmanaged Devices
Unmanaged-devices
You can view, add, or edit the properties
Page
Understanding the security features of the appliance
Securing the appliance
Securing the appliance
Best practices for maintaining a secure appliance
Understanding the security features of the appliance
Creating a login session
Authentication for appliance access
Creating a login session
Specifying user accounts and roles
Controlling access for authorized users
Protecting credentials
Understanding the audit log
Resource category
Message
Understanding the audit log
Overview
Appliance access over SSL
Example 1 Sample audit entries user login and logout
Managing certificates from a browser
Managing certificates from a browser
Using a certificate authority
Verifying a certificate
Downloading and importing a self-signed certificate
SSL connection
Passwords
Browser best practices for a secure environment
Nonbrowser clients
Required ports
Access to the appliance console
Switching from one console to another
Ports needed for HP OneView
SSL see
Enabling or disabling authorized services access
Restricting console access
Algorithms for securing the appliance
Downloads from the appliance
Downloads from the appliance
Page
Browsers
Required plug-ins and settings
Commonly used browser features and settings
Navigating the graphical user interface
About the graphical user interface
Set the browser for US or metric units of measurement
Set US or metric units of measurement
About the graphical user interface
Screen topography
About the Activity sidebar
Banner and main menu
Button functions
Filters sidebar
Help sidebar
UI buttons
Oneviewcommunity online
Icon descriptions
Display details
Status and severity icons
User control icons
Large icon Small icon Resource Activity Task Critical
Informational icons
Map view screen details
Notifications area
Notifications area
Search help topics
Log out of the appliance
About help system search results
Search resources
Nameenclosure10 name192.0.2.0, PDU
Error Unknown Disabled
View resources according to their health status
Advanced searching and filtering with properties
View resources according to their health status
Reset the health status view
Page
Resource data
Using the Rest APIs and other programmatic interfaces
Resource operations
Operation Http Verb Create
Resource model format
Log in to the appliance using Rest APIs
Return codes
URI format
Task resource
Error handling
Concurrency control using etags
Asynchronous versus synchronous operations
Querying resources using common Rest API parameters
State Change Message Bus
Developer tools in a web browser
Rest API help design
Accessing documentation and help
Online help-conceptual and task information as you need it
This user guide supplements the online help
Downloading Html help and Rest API files
Where to find HP OneView documentation
Accessing documentation and help
HP OneView documentation
Part II Planning tasks
Page
Planning your data center resources
How many data centers?
Security planning
Choosing a policy for the audit log
Determining your backup policy
Choosing a security certificate policy
Determining roles and restrictions for authorized users
Preparing your data center network switches
Reviewing your firewall access
Planning your resource names
Planning the appliance configuration
Appliance VM and host requirements
Resource name
Time clocks and NTP
Planning for high availability
Location of the appliance
Separate networks for data and management
Page
Interconnects and logical interconnects
Planning for configuration changes
Appliance
Enclosures
Planning for configuration changes
Server profiles and server hardware
Adding a network
Adding an enclosure
Page
Part III Configuration quick starts
Page
Process overview
Quick Start Initial Configuration
Configure the environment for the first time
Process overview
Fibre Channel
Local authentication
Directory-based authentication
Ethernet
Configuration step Required action or input
Configuration step Add power devices to the appliance
Page
Resource Task Description Networks Add the network
Process
Server Profiles Hardware
Resource Task
Page
Checklist connecting a server blade to a data center network
Page
Resource Task Enclosures
Process
It to the server
Resource Task Logical Create a logical Interconnect
Groups Enclosure
Server Profiles Do one Following Hardware Create a server
Enter a name for
104
105
Resource Task Description Networks Add the Fibre
Sets for the Direct
Attach network
Resource Task Server Hardware Add the server using
Rest APIs for
107
108
Part IV Configuration and management
110
Server-profiles and connections
Server hardware features supported by the appliance
Managing servers and server profiles
UI screens and Rest API resources
Prerequisites for bringing server hardware under management
Roles
Tasks for server profiles
Tasks for server hardware
Tasks for server hardware
Tasks for server hardware types
Effects of managing server hardware iLOs
Learning more
Interconnects
Data center switch port requirements
Managing networks and network resources
Managing Fibre Channel networks SANs
Tasks
Managing Ethernet networks
About network connectivity
Roles
About Fibre Channel networks
Fibre Channel network types
About network connectivity
Direct attach Fibre Channel networks
Fabric attach Fibre Channel networks
Ethernet networks and network sets
About Ethernet networks
About network sets
Fibre Channel networks and FCoE
Network set details
Managing enclosure interconnect hardware
About interconnects
Managing enclosure interconnect hardware
About unsupported interconnects
Interconnects Networking features
Learning more
Connectivity and synchronization with the appliance
About logical interconnects
Server Blade Logical Interconnect
Uplink sets
Stacking modes
Stacking health
Adding a logical interconnect
Deleting a logical interconnect
About logical interconnect groups
Logical Interconnect Group a
About Snmp settings
Interconnect maps
Items Compliance checking Ethernet interconnect settings
Configuration defined by the logical interconnect group?
Set?
Configure a port to monitor network traffic
130
Prerequisites for bringing an enclosure under management
Managing enclosures and enclosure groups
Managing enclosures and enclosure groups
Tasks
About enclosures
Connectivity and synchronization with the appliance
About enclosure groups
Effects of managing an enclosure
About enclosure groups
134
Unsupported firmware for firmware bundles
Managing firmware for managed devices
About the appliance firmware repository
About unsupported firmware
Unsupported firmware for server profiles
Firmware update process
Roles and Tasks
Unsupported firmware for enclosures
Best practices for firmware
Option
Best practice First step Upload the latest current SPP
Best practice
Troubleshooting firmware bundles
Managing power and temperature
Managing power
About power delivery devices
About racks
Managing power and temperature
Managing temperature
Managing temperature
Default data center Datacenter
Default rack placement
About utilization graphs
Managing users and authentication
Reset the administrator password
About user accounts
Action privileges for user roles
About user roles
Action privileges for user roles
Appliance role types
Restores
Administrator Backups
Global settings
Login sessions
About directory service authentication
About authentication settings
Managing user passwords
Managing user passwords
Resetting the administrator password
Reset the administrator password
Backing up an appliance
Overview of the backup process
Backup file name
Backups
Guidelines for creating a backup file
Create and download a backup file
Backing up an appliance
GET /rest/backups/archive/backup URI
Creating and downloading a backup file
Post /rest/backups
Download the backup file
152
How the appliance handles an unexpected shutdown
Managing the appliance
Managing appliance availability
Best practices for managing a VM appliance
Restart the appliance
Appliance recovery operations
What to do when an appliance restarts
Shut down the appliance
Managing the appliance settings
About appliance Snmp settings
Restarting the appliance
Id-pools
Managing the security features of the appliance
Enabling or disabling HP support access to the appliance
Managing addresses and ID pools
Tasks
Managing SSL certificates
Managing the HP public key
Roles
Licenses
Managing licenses
Downloading audit logs
Audit-logs
License reporting
About licensing
License types
License delivery
Server hardware licensing
View license status
License graph colors
Licensed features
Server blade licensing at the enclosure level
Enclosure licensing policy behavior
Rack mount server licensing behavior
Rack mount server licensing
Licensing and utilization statistics
Licensing scenarios
Licensing scenarios
Updating the appliance
Appliance/firmware
How the appliance handles unsupported hardware
About unsupported and unmanaged hardware
How the appliance handles unsupported hardware
About unmanaged devices
166
Part V Monitoring
168
Activities
Monitoring data center status, health, and performance
Daily monitoring
Initial check the Dashboard
General health monitoring steps
Monitor data center temperature
Best practices for monitoring data centers
Best practices for monitoring health with the appliance UI
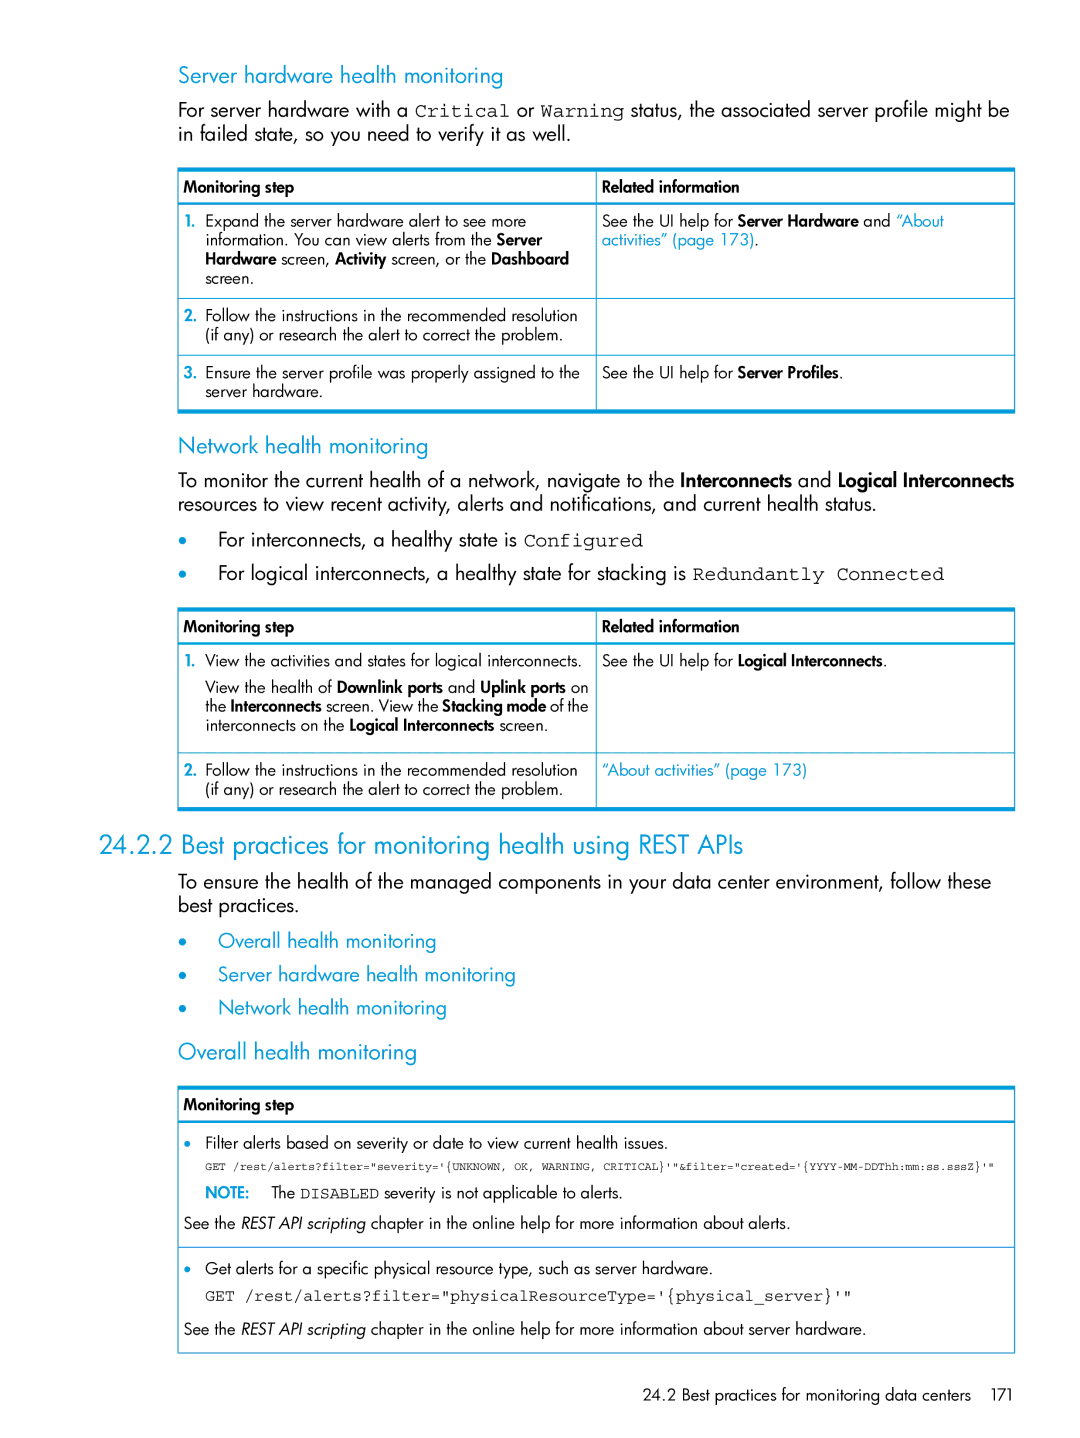
Overall health monitoring
Best practices for monitoring health using Rest APIs
Server hardware health monitoring
Network health monitoring
Get the associated events
Get a specific alert using the alert ID
GET /rest/alerts
GET /rest/alerts/id
Managing activities
Managing activities
About activities
GET /rest/logical-interconnects/id
Task type Description User
Activity types alerts and tasks
About alerts
About tasks
Activity statuses
Activity states
Dashboard screen details
Using the Dashboard screen
How to interpret the Dashboard graphs
About the Dashboard
Status icons
Disabled or Unknown
Monitoring data center status, health, and performance
UI power and temperature monitoring
Monitoring power and temperature
Power and temperature monitoring feature overview
Power and temperature monitoring features by resource
Manipulating the view of the data center visualization
Monitoring power and temperature
Monitoring power and temperature utilization
About the Utilization panel
About utilization graphs
Utilization metric Resource
Enclosures Power Delivery Devices Server Hardware
Utilization statistics gathered by resource
Utilization graphs
Power utilization metrics
Prerequisites
Rest API power and temperature monitoring
Update enclosure power capacity settings
Update server hardware power capacity settings
Create and download the Amqp client certificate
Using the State-Change Message Bus Scmb
GET /rest/certificates/client/rabbitmq/keypair/default
Connect to the Scmb
Using the State-Change Message Bus Scmb
Set up a queue to connect to the HP OneView Scmb exchange
Sample queues
Json structure of message received from the Scmb
NET C# code example
ChangeType values
Example 2 Json example
NET C# code example
Additional example-specific prerequisites
Examples
Java code example
Java code example
Example 5 Java code example
Python code example
Python code example
Example 6 Python code example pika
Example 7 Python code example amqplib
Re-create the Amqp client certificate
Delete /rest/certificates/ca/rabbitmqreadonly
Re-create the Amqp client certificate
196
Part VI Troubleshooting
198
Troubleshooting
Category
199
Recommendation Details Look for a message
Basic troubleshooting techniques
About network setup errors
About reported serious errors
Recommendation Details
When VM host is down or nonresponsive
Create a support dump file
Creating a support dump file
GET /rest/appliance/support-dumps/file name
Creating a support dump using Rest APIs Create support dump
Post /rest/appliance/support-dumps
Download the support dump file
Unexpected appliance shutdown
Troubleshooting the appliance
First time setup
Appliance cannot access the network
Insufficient time
Appliance update is unsuccessful
Support dump file creation action fails
Certificate action fails
Appliance network is down
Backup file creation, download, or restore action fails
Backup file creation is still in progress
Backup file is incompatible
Restart or shutdown failure
Profile operation was running during the backup
Restore operation fails or times out
Internal server error
VM does not restart when VM host time is manually set
Reinstall the remote console
Reinstall the software
Restart interconnect
Troubleshooting enclosures and enclosures groups
Add or remove enclosure is unsuccessful
Clear vcmode
Restart interconnect N
Incorrect credentials
Troubleshooting firmware bundles
Certificate Error
Add server blade is unsuccessful
Troubleshooting licensing
Troubleshooting interconnects
License assigned does not match the type specified
Troubleshooting logical interconnects
27.9.1 I/O bay occupancy errors
Uplink set warnings or errors
Network create operation is unsuccessful
Troubleshooting networks
Troubleshooting server hardware
Physical interconnect warnings and errors
Is claimed by that software
Cannot control power on server blade
Troubleshooting server profiles
Server profile is not created or updated correctly
Troubleshooting server profiles
Prerequisites and conditions have not been met
Verify the operational status of the server hardware
What to do when you cannot apply the server profile
Server hardware or its iLO are powered-off or reset
Invalid configuration
Incorrect privileges
Troubleshooting user accounts
Unauthenticated user or group
Profile operations fail
Inaccurate credentials
Directory service not available
Cannot add directory service
User public key is not accepted
Cannot add directory user or group
Cannot add server for a directory service
Lost connection with directory service host
User or group not configured in the directory service
See also Post-restoration tasks
Restoring an appliance from a backup file
Restore operation overview
Restores
Restoring an appliance from a backup file
Preparing to restore an appliance
Restore an appliance from a backup file
Restore an appliance from a backup file
Post-restoration tasks
Using Rest APIs to restore an appliance from a backup file
Creating a custom script to restore an appliance
Restoring an appliance from a backup file
Post-restoration tasks
Preventing duplicate IDs on the network after a restore
226
Get connected to the HP OneView online user forum
How to contact HP
Software technical support and software updates
Support and other resources
Support and other resources
Using your software technical support and update service
Related information
Documentation Product websites
Docsfeedback@hp.com
Submit documentation feedback
For UI and Rest API help
For user guides and other manuals
230
Tasks you can perform without data center hardware
Tasks you can perform without data center hardware
Information about the sample data center
Sample data center hardware
Enclosure
ILOAdmin
OAAdmin
Rack mount server
Data center networks
Fibre Channel networks
Fibre Channel networks for the SAN fabrics
SAN a and SAN B Fibre Channel network configurations
Switches in the data center
Storage system
Ethernet Networks
Networks for vMotion and virtual machine management
Production networks
Development networks
Planning the configuration
Planning for installation of the appliance
Ethernet network configuration values
Planning the configuration
Planning for network sets
Planning for users and roles
Workflow
Installing the appliance
Planning resource names
Assumptions
Configuring the networks and network sets
Configuring the Fibre Channel SAN networks
Copying the template server profile to eight servers
Configuring the Ethernet networks
Prod 1101 1102 1103 1104
Use the following names and Vlan IDs for the test networks
Configuring the network sets
Page
Creating the logical interconnect group
Creating a logical interconnect group and its uplink sets
Creating the uplink sets for the Fibre Channel networks
Creating the uplink sets for the Ethernet networks
ProdUS
DevUS
TestUS
Click Create to create the logical interconnect group
Creating an enclosure group for vSphere ESXi hosts
172.18.1.12 Address
Enclosures Password
Adding the enclosure
Viewing the server hardware types
View information about the server hardware
Creating a server profile to use as a template
Viewing server hardware types
Editing server hardware types
Page
Esxi vmotion
Attribute Value Device type Ethernet Network
Esxi mgmt
Secondary
Boot Not bootable
Attribute Value Device type Fibre Channel Network
Requested bandwidth
Page
Copying the template server profile to eight servers
Name Server hardware
Esx02 Encl1, bay Esx03 Esx04 Esx05 Esx06 Esx07 Esx08
Creating the Flat SAN networks
172.18.1.14 Address
Page
Page
Enclosure group name
Creating the server profile
Enclosure name
Encl2
Requested bandwidth Default value FlexNIC
Device type Fibre Channel Network
FlatSAN a
FlatSAN B
Page
Assumptions
Powering on the server
Adding the server hardware
Viewing information about the server
Page
Adding a license for the server
Page
Key combinations for the virtual appliance console
Using the virtual appliance console
Using the virtual appliance console
Using the virtual appliance console
270
Sample script
Backup and restore script examples
Sample backup script
Sample backup script
Backup and restore script examples
Example 8 Sample backup.ps1 script
Sample backup script
None, does not accept piping
Sample backup script
Backup and restore script examples
Backup resource object
Absolute path of the download file
Sample backup script
Backup and restore script examples
Sample backup script
Sample restore script
Sample restore script
Example 9 Sample restore.ps1 script
Outputs the new active Api version
Response body to the upload post request
Sample restore script
Outputs the response body from the Post restore call
None, end of script upon completion or fail
Uri of the restore task in string form
Sample restore script
Backup and restore script examples
Host, security access, 80 initial configuration
Index
293
Index
Eula
295
Scmb see State-Change Message Bus
Status icon, 62 storage system website
Logical interconnect, 125 State-Change Message Bus
297
Vlan ID
 Monitoring step