C H A P T E R 5 Using Local Management
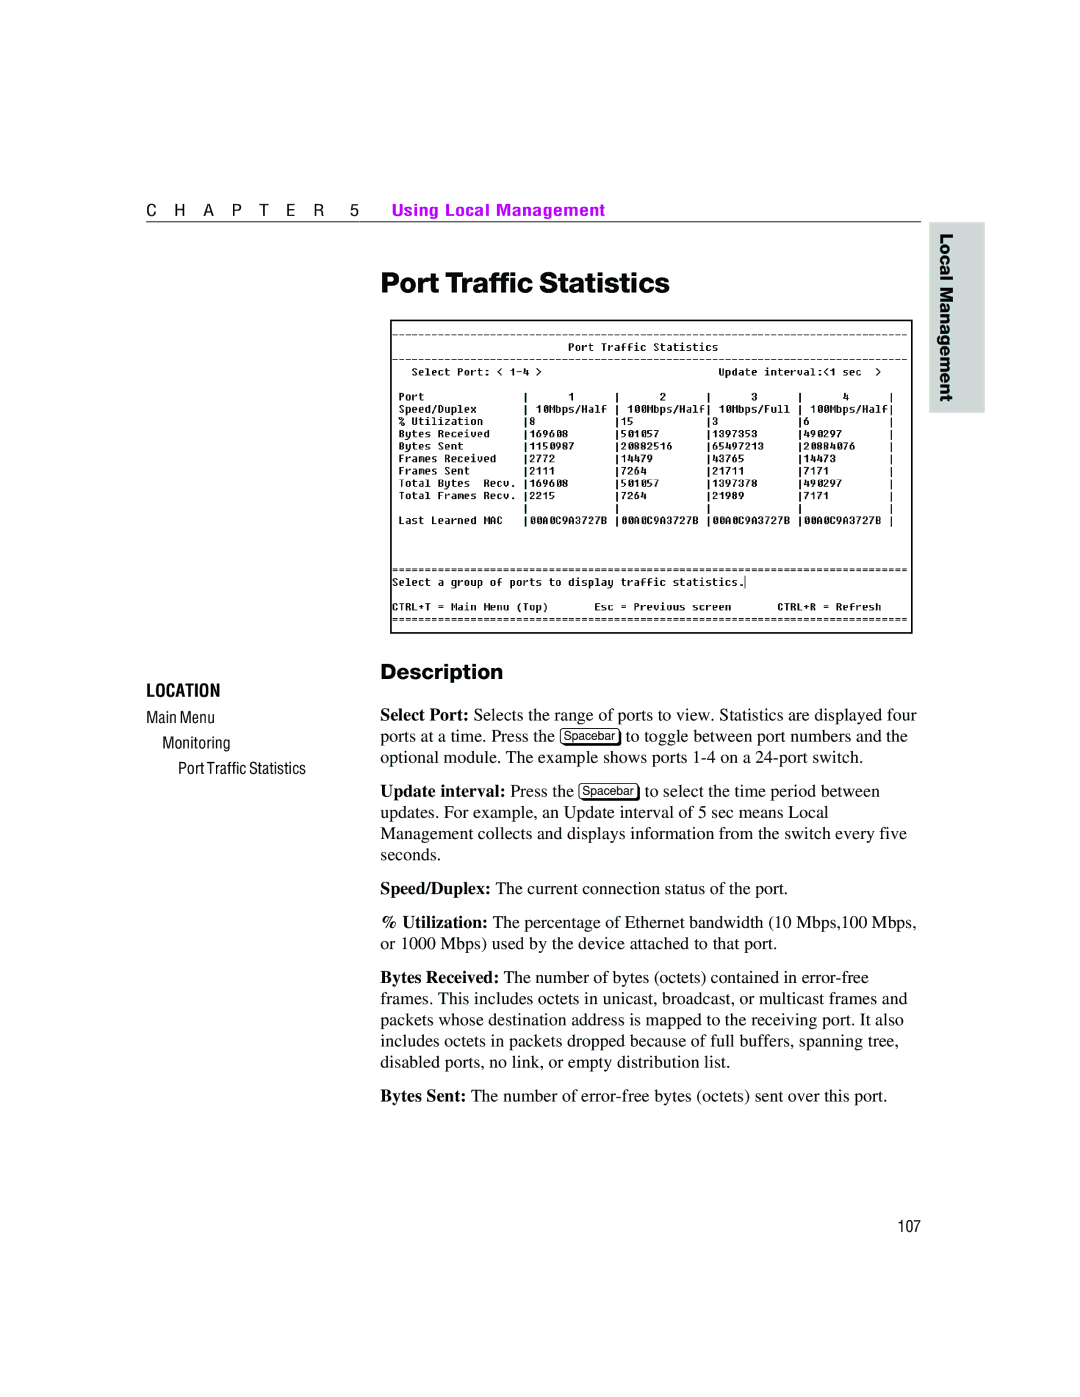
Port Traffic Statistics
Local Management
LOCATION
Main Menu
Monitoring
Port Traffic Statistics
Description
Select Port: Selects the range of ports to view. Statistics are displayed four ports at a time. Press the z to toggle between port numbers and the optional module. The example shows ports
Update interval: Press the z to select the time period between updates. For example, an Update interval of 5 sec means Local Management collects and displays information from the switch every five seconds.
Speed/Duplex: The current connection status of the port.
%Utilization: The percentage of Ethernet bandwidth (10 Mbps,100 Mbps, or 1000 Mbps) used by the device attached to that port.
Bytes Received: The number of bytes (octets) contained in
Bytes Sent: The number of
107