14: Maintenance and Diagnostics Settings
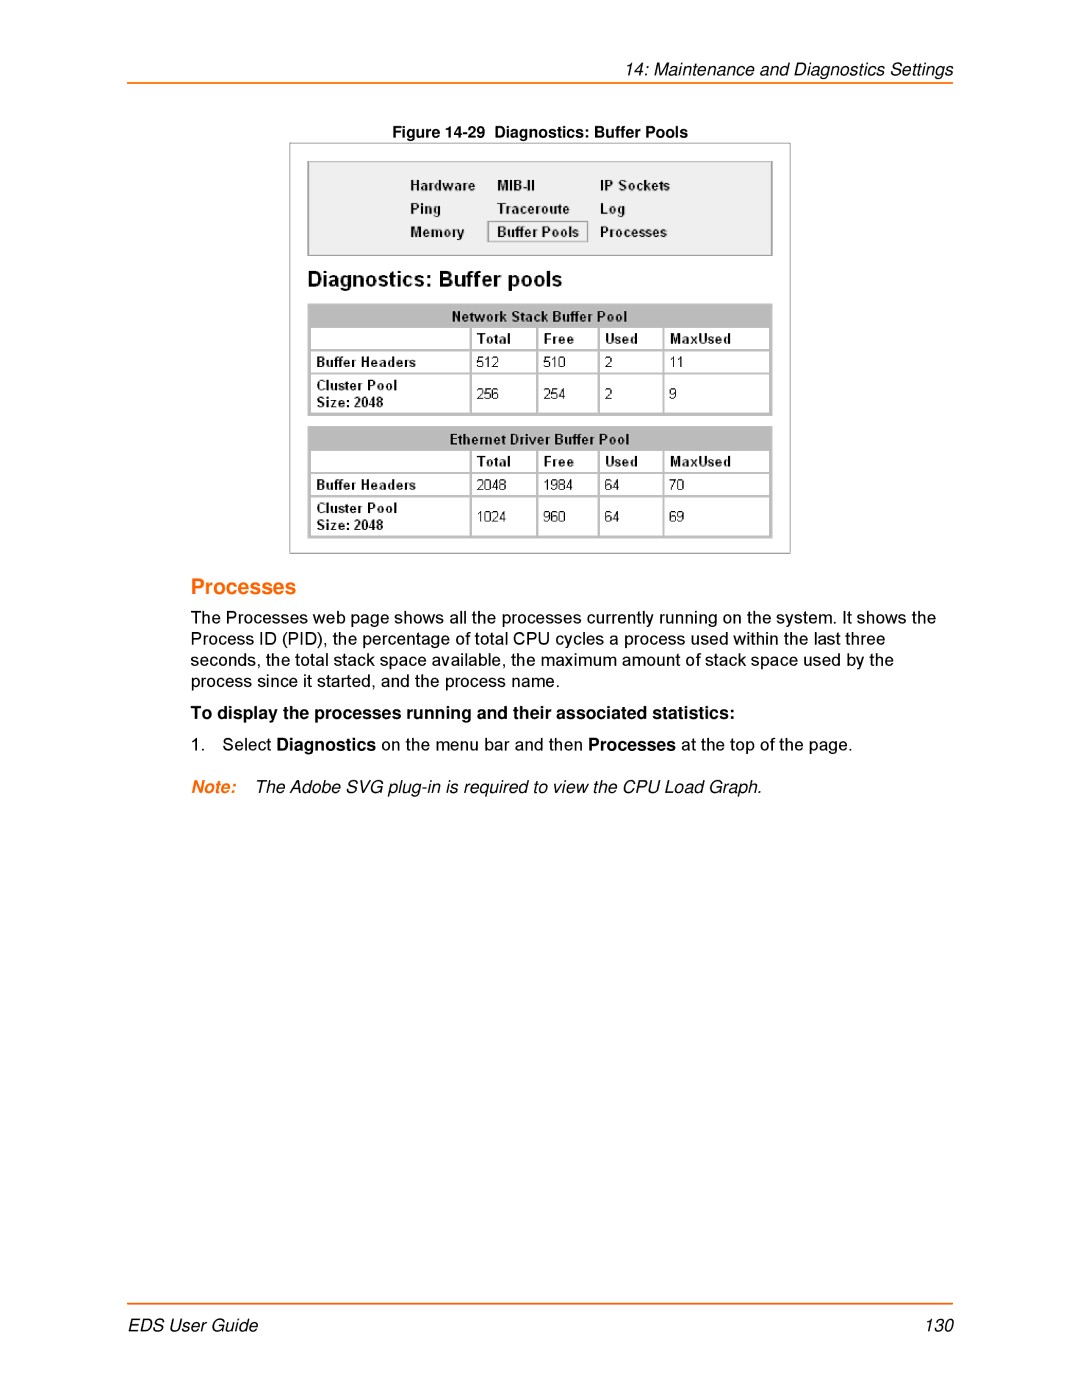
Figure 14-29 Diagnostics: Buffer Pools
Processes
The Processes web page shows all the processes currently running on the system. It shows the Process ID (PID), the percentage of total CPU cycles a process used within the last three seconds, the total stack space available, the maximum amount of stack space used by the process since it started, and the process name.
To display the processes running and their associated statistics:
1. Select Diagnostics on the menu bar and then Processes at the top of the page.
Note: The Adobe SVG
EDS User Guide | 130 |