Command Reference
Alteon OS Command Reference
Contents
Menu Basics
BGP Peer information 100 BGP Summary information
Ospf Database Information 104 Ospf Information Route Codes
CPU Statistics 159 ACL Statistics
Configuration Menu
Failover Trigger Configuration
246
Igmp Version 3 Configuration 287 Igmp Relay Configuration
Operations Menu
Glossary Index
Alteon OS Command Reference 12 „ Contents
Preface
Who Should Use This Book
How This Book Is Organized
AaBbCc123
Typographic Conventions
Typographic Conventions
How to Get Help
Alteon OS Command Reference 18 „ Preface
Command Line Interface
Factory-Default vs. MM assigned IP Addresses
Connecting to the Switch
Management Module Setup
1GbESM IP addresses, based on switch-module bay numbers
Default Gateway
Configuring management module for switch access
1Switch management on the BladeCenter management module
Running Telnet
Connecting to the Switch via Telnet
Telnet switch IP address
Establishing an SSH Connection
Running SSH
# ssh switch IP address
# ssh -1 ace switch IP address
Accessing the Switch
User Access Levels
User Account Description and Tasks Performed Password
Setup Versus CLI
Command Line History and Editing
Idle Timeout
Alteon OS Command Reference 30 „ The Command Line Interface
First-Time Configuration
Starting Setup When You Log
Using the Setup Utility
Information Needed For Setup
Enter admin as the default administrator password
Stopping and Restarting Setup Manually
Setup Part 1 Basic System Configuration
Stopping Setup
Restarting Setup
Enter the day of the current date at the prompt
Setup Part 2 Port Configuration
Turn Spanning Tree Protocol on or off at the prompt
Configure Gigabit Ethernet port autonegotiation mode
Setup Part 3 VLANs
Enter the new Vlan name at the prompt
Setup Part 4 IP Configuration
IP Interfaces
Default Gateways
If configuring VLANs, specify a Vlan for the interface
Setup Part 5 Final Steps
IP Routing
Optional Setup for Telnet Support
# /cfg/sys/access/tnet
Setting Passwords
Changing the Default Administrator Password
Select the administrator password
Changing the Default User Password
System# user/usrpw
Menu Basics
Main Menu
Menu Summary
„ Information Menu
Global Commands
1Description of Global Commands
Chpasss
2Command Line History and Editing Options
Repeat the nth command shown on the history list
Command Line Interface Shortcuts
Command Stacking
Command Abbreviation
Tab Completion
Information Menu
1Information Menu Options /info
Information Menu
Info
Port
Geaport
Sfp
Dump
2System Menu Options /info/sys
System Information
Info/sys
3SNMPv3 information Menu Options /info/sys/snmpv3
Info/sys/snmpv3
SNMPv3 System Information Menu
Group
Comm
Taddr
Tparam
USM User Table Information Parameters /info/sys/usm
Info/sys/snmpv3/usm
SNMPv3 USM User Table Information
Info/sys/snmpv3/view
SNMPv3 View Table Information
SNMPv3 Access Table Information /info/sys/snmpv3/access
Info/sys/snmpv3/access
SNMPv3 Access Table Information
Info/sys/snmpv3/group
Info/sys/snmpv3/comm
SNMPv3 Group Table Information
SNMPv3 Community Table Information
Info/sys/snmpv3/taddr
SNMPv3 Target Address Table Information
Info/sys/snmpv3/tparam
SNMPv3 Target Parameters Table Information
SNMPv3 Notify Table Information /info/sys/snmpv3/notify
Info/sys/snmpv3/notify
SNMPv3 Notify Table Information
Info/sys/snmpv3/dump
SNMPv3 Dump Information
Info/sys/chassis
BladeCenter Chassis Information
Info/sys/general
General System Information
Alteon OS Command Reference
Info/sys/log
Show Recent Syslog Messages
Info/sys/user
User Status
12Layer 2 Menu Options /info/l2
Layer 2 Information
Info/l2
Cist
Trunk
Vlan
Gen
Info/l2/fdb
FDB Information
13FDB Information Menu Options /info/l2/fdb
State unknownforwardtrunk
Clearing Entries from the Forwarding Database
Info/l2/fdb/dump
Show All FDB Information
Info/l2/lacp
Link Aggregation Control Protocol Information
Info/l2/lacp/dump
Show all Lacp Information
Alteon OS Command Reference
Info/l2/8021x
802.1x Information
15802.1x Parameter Descriptions /info/l2/8021x
Parameter Description
Info/l2/stg
Spanning Tree Information
16Spanning Tree Parameter Descriptions
84 „ The Information Menu
RSTP/MSTP Information
Mstp mode can be one of the following Discarding Disc
17RSTP/MSTP Parameter Descriptions
Alternate ALTN, Backup BKUP, Disabled DSB, Master MAST, or
Info/l2/cist
Common Internal Spanning Tree Information
18CIST Parameter Descriptions
Discarding DISC, Learning LRN , or Forwarding
Info/l2/trunk
Trunk Group Information
Info/l2/vlan
Vlan Information
92 „ The Information Menu
19Layer 3 Menu Options /info/l3
Layer 3 Information
Info/l3
Igmp
Vrrp
Info/l3/route
IP Routing Information
20Route Information Menu Options /info/l3/route
Type indirectdirectlocalbroadcastmartianmulticast
21IP Routing Type Parameters
Info/l3/route/dump
Show All IP Route Information
22IP Routing Tag Parameters
Info/l3/arp
ARP Information
23ARP Information Menu Options /info/l3/arp
Addr
Info/l3/arp/dump
Info/l3/arp/addr
Show All ARP Entry Information
ARP Address List Information
Info/l3/bgp
BGP Information
Info/l3/bgp/peer
BGP Peer information
Info/l3/bgp/summary
BGP Summary information
Info/l3/bgp/dump
Show all BGP Information
26OSPF Information Menu options /info/l3/ospf
Info/l3/ospf
Ospf Information
Info/l3/ospf/general
Ospf General Information
Info/l3/ospf/if
Info/l3/ospf/dbase
Ospf Interface Information
Ospf Database Information
All
Dbsumm
Self
Info/l3/ospf/routes
Ospf Information Route Codes
Info/l3/rip
Routing Information Protocol Information
Info/l3/rip/routes
Info/l3/rip/dump interface number
Info/l3/ip
IP Information
Mrouter
Info/l3/igmp
Igmp Multicast Group Information
Info/l3/igmp/dump
Igmp Group Information
Info/l3/igmp/mrouter
Igmp Multicast Router Port Information
Info/l3/igmp/mrouter/dump
Igmp Mrouter Information
Info/l3/vrrp
Vrrp Information
Quality of Service Information
Info/qos
Info/qos/8021p
802.1p Information
32802.1p Priority-to-COS Queue Parameter Descriptions
33802.1p Port Priority Parameter Descriptions
34ACL Parameter Descriptions
Access Control List Information
Info/acl
Link Status Information
Info/link
Port Information
Info/port
Logical Port to GEA Port Mapping
Info/geaport
Fiber Port SFP Status
Information Dump
Info/sfp
Info/dump
Alteon OS Command Reference 120 „ The Information Menu
Statistics Menu
Stats
1Statistics Menu Options /stats
Clrports
Snmp
Ntp clear
Port Statistics
2Port Statistics Menu Options /stats/port
Brg
Ether
802.1x Authenticator Statistics
3802.1x Authenticator Statistics of a Port /stats/port/8021x
802.1x Authenticator Diagnostics
Authenticating to ABORTING, as a result of an EAPOL-Start
Bridging Statistics
5Bridging Statistics of a Port /stats/port/brg
128 „ The Statistics Menu
Ethernet Statistics
6Ethernet Statistics for Port /stats/port/ether
130 „ The Statistics Menu
6Ethernet Statistics for Port /stats/port/ether
Interface Statistics
7Interface Statistics for Port /stats/port/if
This counter will always be
Interface Protocol Statistics
Link Statistics
8Interface Protocol Statistics /stats/port/ip
9Link Statistics /stats/port/link
Layer 2 Statistics
Stats/l2
Stats/l2/fdb
FDB Statistics
Lacp Statistics
12LACP Statistics /stats/lacp
Layer 3 Statistics
Stats/l3
13Layer 3 Statistics Menu Options /stats/l3
Geal3
Icmp
Tcp
Udp
Clrvrrp
14IP Statistics stats/l3/ip
Stats/l3/ip
IP Statistics
140 „ The Statistics Menu
Stats/l3/route
Stats/l3/arp
ARP statistics
15Route Statistics /stats/l3/route
Stats/l3/dns
DNS Statistics
Stats/l3/icmp
Icmp Statistics
Number of Icmp Destination Unreachable messages received
144 „ The Statistics Menu
19TCP Statistics /stats/l3/tcp
Stats/l3/tcp
TCP Statistics
146 „ The Statistics Menu
20UDP Statistics /stats/l3/udp
Stats/l3/udp
UDP Statistics
21IGMP Statistics /stats/l3/igmp
Stats/l3/igmp Vlan number
Igmp Statistics
Stats/l3/ospf
Ospf Statistics
22OSPF Statistics Menu /stats/l3/ospf
Aindex
Stats/l3/ospf/general
Ospf Global Statistics
23OSPF General Statistics stats/l3/ospf/general
Rx/Tx Stats
Nbr Change Stats
Timers Kickoff
Intf Change Stats
24VRRP Statistics /stats/l3/vrrp
Stats/l3/vrrp
Vrrp Statistics
Stats/l3/rip
Routing Information Protocol Statistics
25Management Processor Statistics Menu Options /stats/mp
Management Processor Statistics
Stats/mp
26Packet Statistics /stats/mp/pkt
Stats/mp/pkt
MP Packet Statistics
Stats/mp/tcb
Stats/mp/ucb
UCB Statistics
27MP Specified TCP Statistics /stats/mp/tcb
28CPU Statistics stats/mp/cpu
Stats/mp/cpu
CPU Statistics
ACL Statistics
Stats/acl
Stats/acl/acl ACL number
ACL Statistics
Stats/acl/meter meter number
ACL Meter Statistics
30SNMP Statistics /stats/snmp
Snmp Statistics
Stats/snmp
Tocol entity when decoding Snmp Messages received
164 „ The Statistics Menu
Been generated by the Snmp protocol entity
31NTP Statistics Parameters /stats/ntp
NTP Statistics
Stats/ntp
31 NTP Statistics Parameters /stats/ntp
Statistics Dump
Stats/dump
Alteon OS Command Reference 168 „ The Statistics Menu
Configuration Menu
Configuration Menu
1Configuration Menu Options /cfg
Setup
Cfg
Cur
Viewing, Applying, and Saving Changes
Viewing Pending Changes
Applying Pending Changes
# apply
# save n
Saving the Configuration
# save
Cfg/sys
System Configuration
2System Configuration Menu Options /cfg/sys
Olddst enabledisable
E2e enabledisable
Ntp
Ssnmp
Hgibp enabledisable
Hprompt disableenable
Reminders disableenable
Bannr string, maximum 80 characters
System Host Log Configuration
Console disableenable
Cfg/sys/syslog
3Host Log Menu Options /cfg/sys/syslog
Cfg/sys/sshd
SSH Server Configuration
4System Configuration Menu Options /cfg/sys/sshd
Radius Server Configuration
5System Configuration Menu Options /cfg/sys/radius
Cfg/sys/radius
Off
Timeout Radius server timeout seconds
Bckdoor disableenable
TACACS+ Server Configuration
Cfg/sys/tacacs+
Secbd enabledisable
Cmap enabledisable
Passch enabledisable
6TACACS+ Server Menu Options /cfg/sys/tacacs
Cauth disableenable
Clog disableenable
7LDAP Server Menu Options /cfg/sys/ldap
Ldap Server Configuration
Cfg/sys/ldap
Telnet disableenable
NTP Server Configuration
8System Configuration Menu Options /cfg/sys/ntp
Dlight disableenable
Cfg/sys/ntp
Disables the NTP synchronization service
System Snmp Configuration
Cfg/sys/ssnmp
Timeout
Auth disableenable
Linkt port disableenable
9System Snmp Menu Options /cfg/sys/ssnmp
Cfg/sys/ssnmp/snmpv3
SNMPv3 Configuration
10SNMPv3 Configuration Menu Options /cfg/sys/ssnmp/snmpv3
V1v2 disableenable
Comm snmpCommunity number
Taddr snmpTargetAddr number
Notify notify index
User Security Model Configuration
Cfg/sys/ssnmp/snmpv3/usm
SNMPv3 View Configuration
Cfg/sys/ssnmp/snmpv3/view
12SNMPv3 View Menu Options /cfg/sys/ssnmp/snmpv3/view
Del
Cfg/sys/ssnmp/snmpv3/access
View-based Access Control Model Configuration
Model usmsnmpv1snmpv2
Level noAuthNoPrivauthNoPrivauthPriv
Nview 32 character view name
Rview 32 character view name
Wview 32 character view name
SNMPv3 Group Configuration
Cfg/sys/ssnmp/snmpv3/group
14SNMPv3 Group Menu Options /cfg/sys/ssnmp/snmpv3/group
Uname 32 character name
SNMPv3 Community Table Configuration
Cfg/sys/ssnmp/snmpv3/comm
Index 32 character name
Tag list of tag string, max 255 characters
SNMPv3 Target Address Table Configuration
Cfg/sys/ssnmp/snmpv3/taddr
Mpmodel snmpv1snmpv2csnmpv3
SNMPv3 Target Parameters Table Configuration
Cfg/sys/ssnmp/snmpv3/tparam
18Notify Table Menu Options /cfg/sys/ssnmp/snmpv3/notify
SNMPv3 Notify Table Configuration
Cfg/sys/ssnmp/snmpv3/notify
19System Access Menu Options /cfg/sys/access
Cfg/sys/access
System Access Configuration
Tnport TCP port number
Tport Tftp port number
Cfg/sys/access/mgmt
Management Networks Configuration
20Management Network Menu Options /cfg/sys/access/mgmt
Add mgmt network address mgmt network mask
21User Access Control Menu Options /cfg/sys/access/user
Cfg/sys/access/user
User Access Control Configuration
Cfg/sys/access/user/uid
System User ID Configuration
Cos useroperadmin
Name 1-8 characters
Cfg/sys/access/user/strongpw
Strong Password Configuration
Expiry
Faillog
Cfg/sys/access/https
Https Access Configuration
Port TCP port number
Generate
Port Configuration
25Port Configuration Menu /cfg/port
Tagpvid disableenable
Fastfwd disableenable
Port Link Configuration
26Port Link Configuration Menu Options /cfg/port/gig
Port ACL Configuration
Temporarily Disabling a Port
27Port ACL Menu Options /cfg/port/aclqos
Add aclblkgrp
ACL Port Metering Menu
28ACL Metering Menu Options /cfg/port/aclqos/meter
Re-Mark Menu
29ACL Re-Mark Options /cfg/port/aclqos/re-mark
Inprof
Outprof
Updscp
Re-Marking In-Profile Menu
Up1p
Value
Update User Priority Menu
Utosp enabledisable
Re-Marking Out-of-Profile Menu
Cfg/l2
Layer 2 Configuration
33Layer 2 Configuration Menu /cfg/l2
Upfast enabledisable
Update
Bpdugrd enabledisable
Macnotif enabledisable
802.1x Configuration
34802.1x Configuration Menu /cfg/l2/8021x
Cfg/l2/8021x
Global
802.1x Global Configuration
Cfg/l2/8021x/global
Default
Svrtmout
Maxreq
Raperiod
Vlan
802.1x Guest Vlan Configuration
Cfg/l2/8021x/global/gvlan
Cfg/l2/8021x/port alias or number
802.1x Port Configuration
37802.1x Port Configuration Menu Options /cfg/l2/8021x/port
224 „ The Configuration Menu
38MSTP/RSTP Configuration Menu Options /cfg/l2/mrst
Cfg/l2/mrst
Name 1-32 characters
Rev
Mode rstpmstp
Common Internal Spanning Tree Configuration
Cfg/l2/mrst/cist
39CIST Menu Options /cfg/l2/mrst/cist
Add Vlan numbers
Cist Bridge Configuration
Cfg/l2/mrst/cist/brg
Prior
Mxage 6-40 seconds
Cist Port Configuration
Link auto, p2p, or shared default auto
Cfg/l2/mrst/cist/port port alias or number
Cost
Edge disableenable
Spanning Tree Configuration
42Spanning Tree Configuration Menu /cfg/l2/stg
Add Vlan number
Remove Vlan number
232 „ The Configuration Menu
43Spanning Tree Bridge Menu Options /cfg/l2/stg/brg
Spanning Tree Bridge Configuration
Cfg/l2/stg STP group number/brg
Fwd new bridge Forward Delay 4-30 secs
Aging new bridge Aging Time 1-65535 secs, 0 to disable
Spanning Tree Port Configuration
Cost new port Path Cost 1-65535, 0 for default
44Spanning Tree Port Menu Options /cfg/l2/stg/port
Prior new port Priority
236 „ The Configuration Menu
45FDB Menu Options /cfg/l2/fdb
Forwarding Database Configuration
Cfg/l2/fdb
46Static FDB Menu Options /cfg/l2/fdb/static
Static FDB Configuration
Cfg/l2/fdb/static
Trunk Configuration
47Trunk Configuration Menu Options /cfg/l2/trunk
Add port alias or number
Rem port alias or number
IP Trunk Hash Configuration
Cfg/l2/thash
Cfg/l2/thash/set
IP Trunk Hash
Smac enabledisable
Dmac enabledisable
Sip enabledisable
Dip enabledisable
Lacp Configuration
Timeout shortlong
Cfg/l2/lacp
50LACP Menu Options /cfg/l2/lacp
Lacp Port Configuration
Mode offactivepassive
Adminkey
51LACP Port Menu Options /cfg/l2/lacp/port
Layer 2 Failover Configuration
Cfg/l2/failovr
52Layer 2 Failover Menu Options /cfg/l2/failovr
Trigger
Failover Trigger Configuration
Cfg/l2/failovr/trigger
53Failover Trigger Menu Options /cfg/l2/failovr/trigger
Amon
54Auto Monitor Menu Options /cfg/l2/failovr/trigger/amon
Auto Monitor Configuration
Cfg/l2/failovr/trigger/amon
Cfg/l2/vlan Vlan number
Vlan Configuration
55VLAN Configuration Menu Options /cfg/l2/vlan
Def list of port numbers
56PVLAN Menu Options /cfg/l2/vlan/pvlan
Protocol-based Vlan Configuration
Cfg/l2/vlan/pvlan protocol number
Tagpvl enabledisable
Taglist
Private Vlan Configuration
Cfg/l2/vlan/privlan
57Private Vlan Menu Options /cfg/l2/vlan/privlan
Map
Layer 3 Configuration
58Layer 3 Configuration Menu /cfg/l3
Cfg/l3
Mroute
Rtrid IP address such as, 192.4.17.101 Sets the router ID
Bootp
Rmap route map number
IP Interface Configuration
Relay disableenable
59IP Interface Menu Options /cfg/l3/if
Addr IP address such as
Arp disableenable
Default Gateway Configuration
60Default Gateway Menu Options /cfg/l3/gw
IP Static Route Configuration
61IP Static Route Configuration Menu Options cfg/l3/route
Cfg/l3/route
Add destination mask gateway interface number
Cfg/l3/mroute
IP Multicast Route Configuration
62IP Static Route Configuration Menu Options cfg/l3/mroute
ARP Configuration
63ARP Configuration Menu Options /cfg/l3/arp
Cfg/l3/arp
Rearp 2-120 minutes
Cfg/l3/arp/static
ARP Static Configuration
64ARP Static Configuration Menu Options /cfg/l3/arp/static
IP Forwarding Configuration
65IP Forwarding Configuration Menu Options /cfg/l3/frwd
Dirbr disableenable
Noicmprd disableenable
66IP Network Filter Menu Options /cfg/l3/nwf
Network Filter Configuration
Cfg/l3/nwf
Type value 12none
Routing Map Configuration
67Routing Map Menu Options /cfg/l3/rmap
Weight value 0-65534noneSets the weight of the route map
Prec value
Action permitdeny
IP Access List Configuration
68IP Access List Menu Options /cfg/l3/rmap/alist
Autonomous System Filter Path
69AS Filter Menu Options /cfg/l3/rmap/aspath
As AS number
Current
Routing Information Protocol Configuration
Update
Cfg/l3/rip
70RIP Menu Options /cfg/l3/rip
Routing Information Protocol Interface Configuration
71RIP Interface Menu Options /cfg/l3/rip/if
Trigg disableenable
Mcast disableenable
Default nonelistensupplyboth
Auth nonepassword
Cfg/l3/ospf
Open Shortest Path First Configuration
72OSPF Configuration Menu /cfg/l3/ospf
Default metric 1-16777214 metric-type 12none
Area Index Configuration
73Area Index Configuration Menu Options /cfg/l3/ospf/aindex
Auth nonepasswordmd5
Cfg/l3/ospf/aindex area index
Cfg/l3/ospf/range range number
Ospf Summary Range Configuration
Hide disableenable
Ospf Interface Configuration
75OSPF Interface Configuration Menu Options /cfg/l3/ospf/if
Prio priority value
Cost cost value
Key key none
Ospf Virtual Link Configuration
Key password
Cfg/l3/ospf/virt link number
Nbr NBR router ID IP address
Ospf Host Entry Configuration
Cfg/l3/ospf/host host number
Ospf Route Redistribution Configuration
Add route map 1-32 route map 1-32... all
Rem route map 1-32 route map 1-32 ... all
Export metric 1-16777214metric type 12 none
Ospf MD5 Key Configuration
Cfg/l3/ospf/md5key key ID
Border Gateway Protocol Configuration
Cfg/l3/bgp
80Border Gateway Protocol Menu /cfg/l3/bgp
Peer peer number
Pref local preference
BGP Peer Configuration
81BGP Peer Configuration Menu Options /cfg/l3/bgp/peer
Cfg/l3/bgp/peer peer number
Redist
Advert min adv time
Retry connect retry interval
Orig min orig time
Ttl number of router hops
82BGP Redistribution Menu Options /cfg/l3/bgp/peer/redist
BGP Redistribution Configuration
Cfg/l3/bgp/peer/redist
BGP Aggregation Configuration
Cfg/l3/bgp/aggr aggregation number
84IGMP Menu Options /cfg/l3/igmp
Igmp Configuration
Cfg/l3/igmp
Igmp Snooping Configuration
Aggr enabledisable
Cfg/l3/igmp/snoop
85IGMP Snoop Menu Options /cfg/l3/igmp/snoop
86IGMP V3 Menu Options /cfg/l3/igmp/snoop/igmpv3
Igmp Version 3 Configuration
Cfg/l3/igmp/snoop/igmpv3
Igmp Relay Configuration
Cfg/l3/igmp/relay
87IGMP Relay Menu Options /cfg/l3/igmp/relay
Mrtr multicast router number
Igmp Relay Multicast Router Configuration
Cfg/l3/igmp/mrtr Mrouter number
88IGMP Relay Mrouter Menu Options /cfg/l3/igmp/relay/mrtr
Version
Igmp Static Multicast Router Configuration
Cfg/l3/igmp/mrouter
Add port number Vlan number Igmp version number
Remove port number Vlan number Igmp version number
Igmp Filtering Configuration
Cfg/l3/igmp/igmpflt
90IGMP Filtering Menu Options /cfg/l3/igmp/igmpflt
Filter filter number
Action allowdeny
Cfg/l3/igmp/igmpflt/filter filter number
Igmp Filter Definition
Igmp Filtering Port Configuration
Filt enabledisable
Cfg/l3/igmp/igmpflt/port port alias or number
92IGMP Filter Port Menu Options /cfg/l3/igmp/igmpflt/port
93IGMP Advanced Menu Options /cfg/l3/igmp/adv
Igmp Advanced Configuration
Cfg/l3/igmp/adv
Cfg/l3/dns
Domain Name System Configuration
94Domain Name Service Menu Options /cfg/l3/dns
Cfg/l3/bootp
Bootstrap Protocol Relay Configuration
Vrrp Configuration
Cfg/l3/vrrp
96VRRP Menu Options /cfg/l3/vrrp
Vr virtual router number
Hotstan disableenable
Virtual Router Configuration
Cfg/l3/vrrp/vr router number
97VRRP Virtual Router Menu Options /cfg/l3/vrrp/vr
Vrid virtual router ID
Adver seconds
Preem disableenable
Prio priority
Virtual Router Priority Tracking Configuration
Vrs disableenable
Ifs disableenable
Ports disableenable
99Virtual Router Group Menu Options /cfg/l3/vrrp/group
Virtual Router Group Configuration
Cfg/l3/vrrp/group
Enables the virtual router group
Virtual Router Group Priority Tracking Configuration
Cfg/l3/vrrp/group/track
101VRRP Interface Menu Options /cfg/l3/vrrp/if
Vrrp Interface Configuration
Passw password
102VRRP Tracking Menu Options /cfg/l3/vrrp/track
Vrrp Tracking Configuration
Cfg/l3/vrrp/track
Quality of Service Configuration
103Quality of Service Menu Options /cfg/qos
Cfg/qos
Dscp
802.1p Configuration
Cfg/qos/8021p
104802.1p Menu Options /cfg/qos/8021p
Numcos
Dscp Configuration
Cfg/qos/dscp
105DSCP Menu Options /cfg/qos/dscp
Dscp 0-63
Access Control List Configuration
Cfg/acl
106ACL Menu Options /cfg/acl
Block
107ACL Menu Options /cfg/acl/acl
ACL Configuration
Cfg/acl/acl ACL number
Ethernet Filtering Configuration
Cfg/acl/acl ACL number/ethernet
108Ethernet Filtering Menu Options /cfg/acl/acl x/ethernet
Pri
109IP version 4 Filtering Menu Options /cfg/acl/acl x/ipv4
IP version 4 Filtering Configuration
Cfg/acl/acl ACL number/ipv4
110TCP/UDP Filtering Menu Options /cfg/acl/acl x/tcpudp
TCP/UDP Filtering Configuration
Cfg/acl/acl ACL number/tcpudp
Packet Format Filtering Configuration
Cfg/acl/acl ACL number/pktfmt
Ethfmt eth2SNAPLLC
Tagfmt nonetagged
ACL Block Menu
112ACL Block Menu options /cfg/acl/block
Addac1
Remac1
ACL Group Configuration
113ACL Group Menu Options /cfg/acl/group
Add acl
Rem acl
Port Mirroring Configuration
Cfg/pmirr
114Port Mirroring Menu Options /cfg/pmirr
Monport port alias or number
Rem mirrored port port to mirror from
Port-Mirroring Configuration
Cfg/pmirr/monport
Setup
Cfg/setup
Dump
Cfg/dump
Saving the Active Switch Configuration
Restoring the Active Switch Configuration
Configuration# ptcfg Tftp server filename
Configuration# gtcfg Tftp server filename
Alteon OS Command Reference 322 „ The Configuration Menu
Operations Menu
1Operations Menu /oper
Operations Menu
Oper
Operations-Level Port Options
2Operations-Level Port Menu Options /oper/port
Operations-Level Port 802.1x Options
Reauth
Oper/vrrp
Operations-Level Vrrp Options
4Operations-Level Vrrp Menu Options /oper/vrrp
Back virtual router number
Oper/ip
Operations-Level IP Options
Oper/ip/bgp
Operations-Level BGP Options
Boot Options Menu
Boot Menu
Scheduled Reboot of the Switch
Boot
Boot/sched
Using the BBI
Updating the Switch Software Image
Loading New Software to Your Switch
332 „ The Boot Options Menu
Using the AOS CLI
Enter the name of the new software file on the server
Selecting a Software Image to Run
Uploading a Software Image from Your Switch
System prompts you for information. Enter the desired image
Selecting a Configuration Block
Resetting the Switch
Accessing the Iscli
Main# boot/mode iscli
Routerconfig# boot cli-mode aos
Alteon OS Command Reference 338 „ The Boot Options Menu
Maintenance Menu
Maintenance Menu
1Maintenance Menu /maint
Maint
Debug
Uudmp
Ptfile
Cldmp
Panic
System Maintenance
2System Maintenance Menu Options /maint/sys
Maint/sys
Flags new Nvram flags word as
3FDB Manipulation Menu Options /maint/fdb
Forwarding Database Maintenance
Maint/fdb
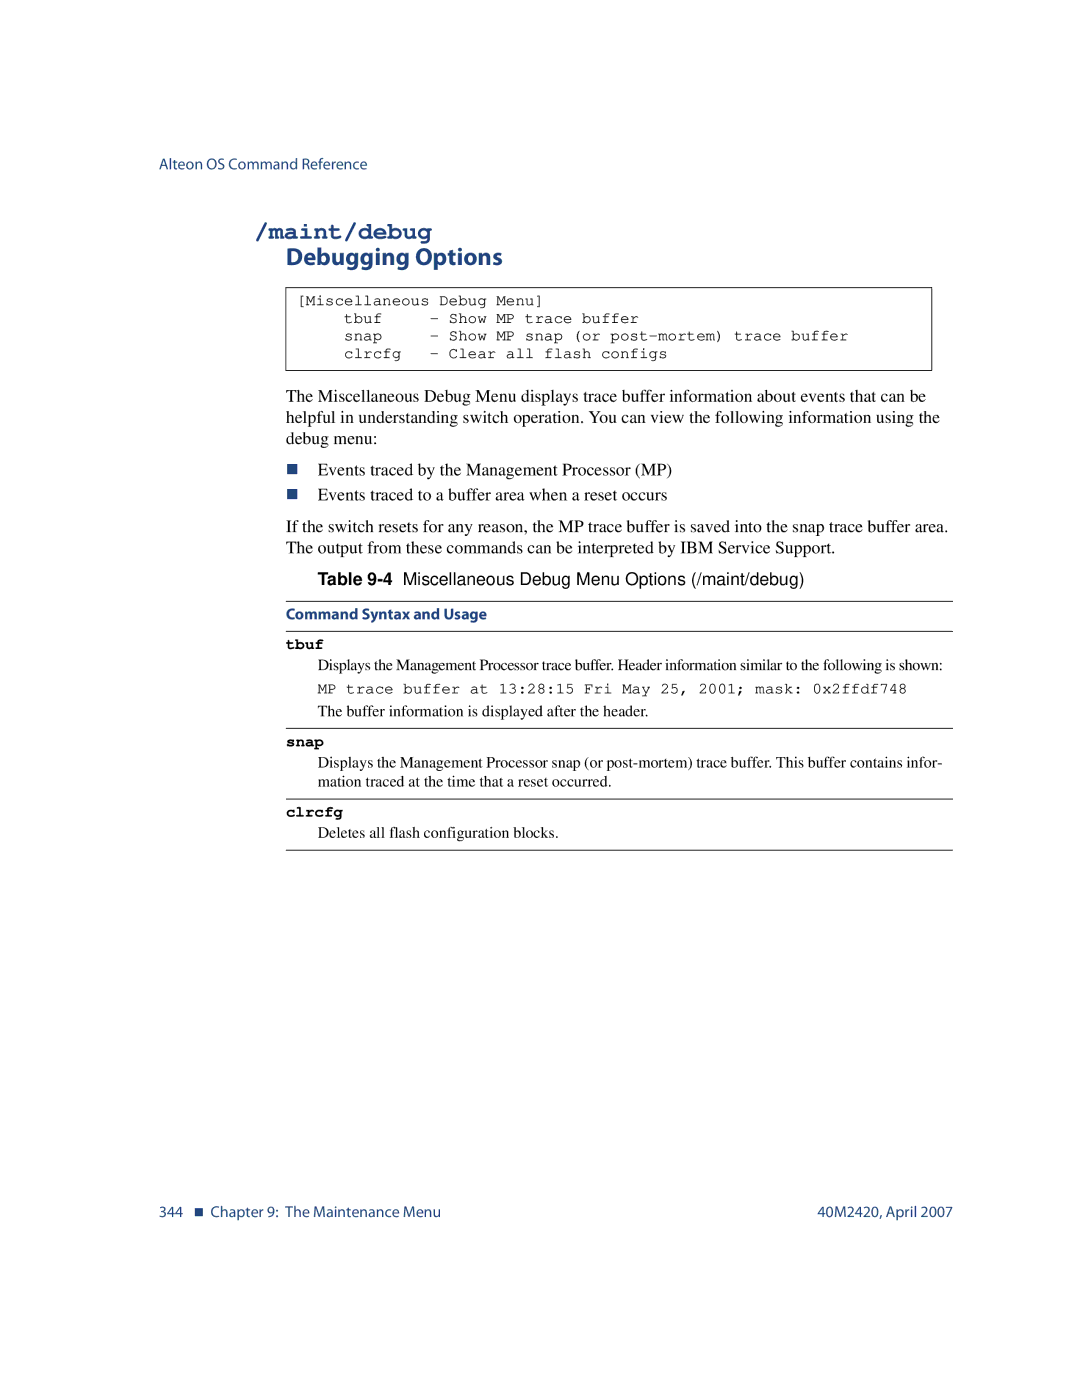
4Miscellaneous Debug Menu Options /maint/debug
Maint/debug
Debugging Options
Maint/arp
ARP Cache Maintenance
5ARP Maintenance Menu Options /maint/arp
6IP Route Manipulation Menu Options /maint/route
Maint/route
IP Route Manipulation
Igmp Maintenance
Igmp Group Maintenance
7IGMP Maintenance Menu Options /maint/igmp
Maint/igmp
Maint/igmp/mrouter
Igmp Multicast Routers Maintenance
9IGMP Mrouter Maintenance Menu Options /maint/igmp/mrouter
Maint/uudmp
Uuencode Flash Dump
Clearing Dump Information
Tftp System Dump Put
Maint/cldmp
Maint/panic
Panic Command
Unscheduled System Dumps
Alteon OS Command Reference 352 „ The Maintenance Menu
Alteon OS Syslog Messages
Logalert
Logcritical
Logerror
Logerror
358 „ Appendix a Alteon OS Syslog Messages
Synchronization Receive Unknown Timeout
Lognotice
Lognotice
362 „ Appendix a Alteon OS Syslog Messages
Loginfo
Loginfo
Alteon OS Snmp Agent
10Alteon OS-Supported Enterprise Snmp Traps
AltSwVrrpAuthFailure
AltSwTcpHoldDown
Working with Switch Images Configuration Files
MIB OID
Loading a new switch image
If you are using an FTP server, enter a password
Loading a saved switch configuration
Saving the switch configuration
Saving a switch dump
40M2420, April
Glossary
VIR Virtual Interface
Index
Igmp
175
109
Operations-level IP options 328
Vlan ID
365
UDP