CONSOLE INTERFACE
Showing Port Statistics
You can display standard statistics on network traffic from the Interfaces Group MIB,
Field Attributes
See “Showing Port Statistics” on page
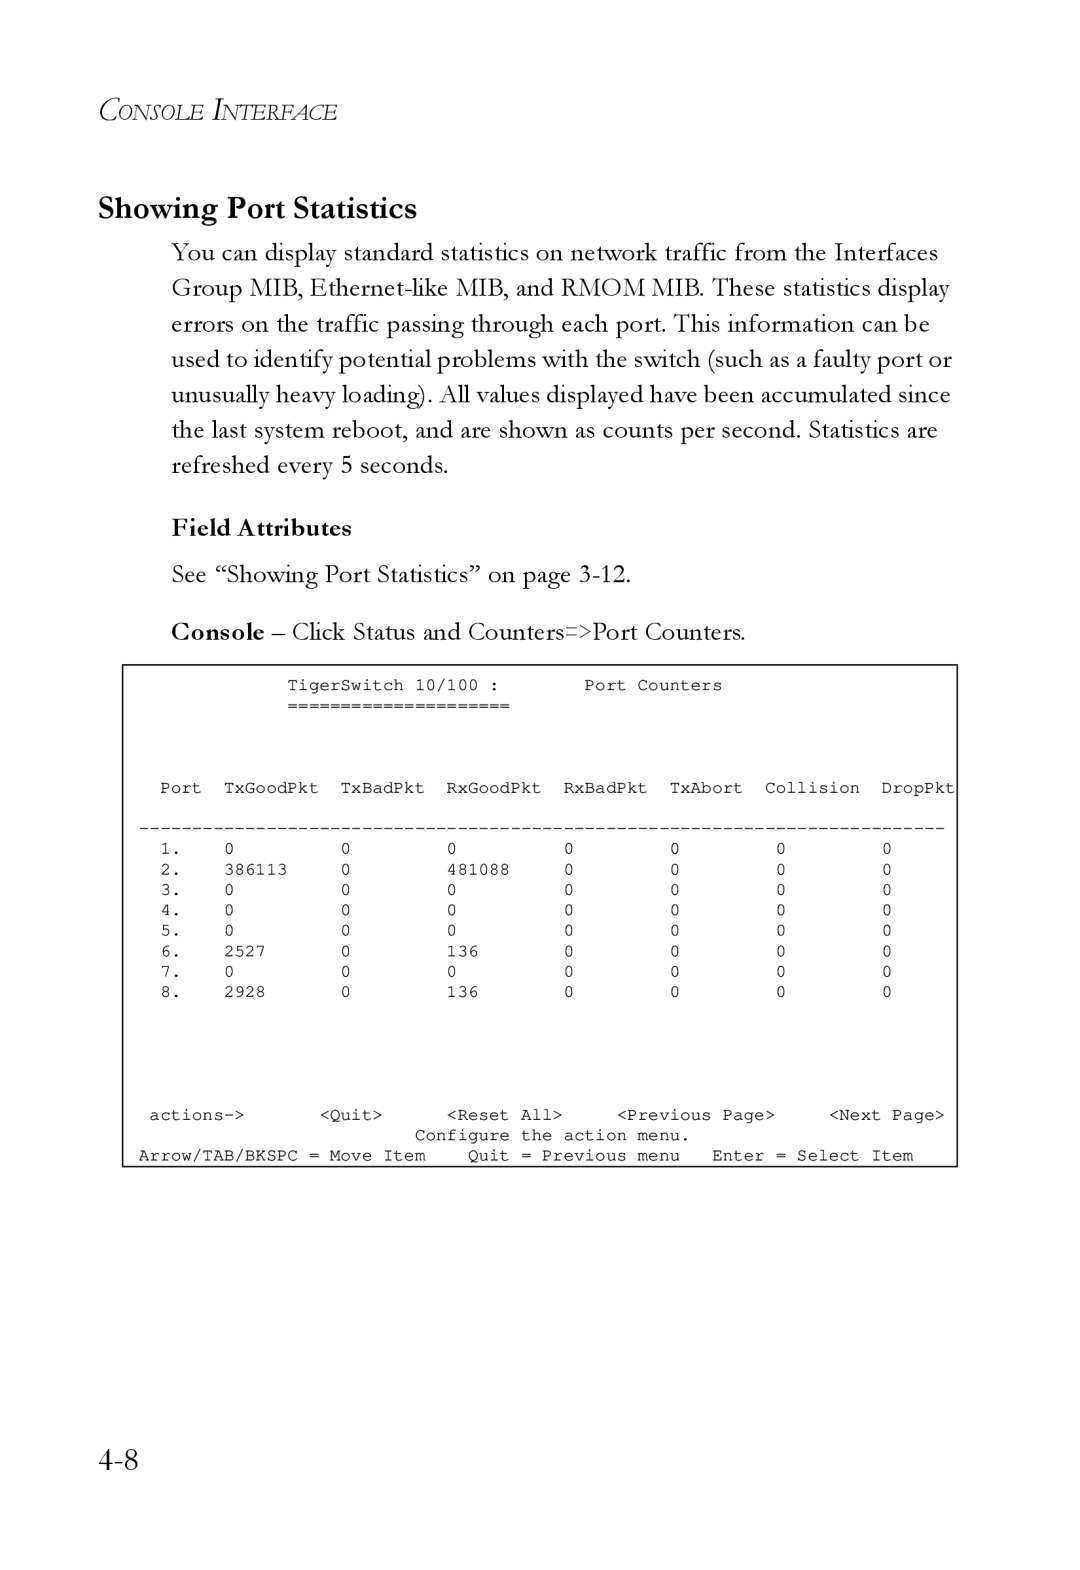
Console – Click Status and Counters=>Port Counters.
TigerSwitch 10/100 : | Port Counters |
===================== |
|
Port TxGoodPkt TxBadPkt RxGoodPkt | RxBadPkt TxAbort Collision DropPkt |
1. | 0 | 0 | 0 | 0 | 0 | 0 | 0 |
2. | 386113 | 0 | 481088 | 0 | 0 | 0 | 0 |
3. | 0 | 0 | 0 | 0 | 0 | 0 | 0 |
4. | 0 | 0 | 0 | 0 | 0 | 0 | 0 |
5. | 0 | 0 | 0 | 0 | 0 | 0 | 0 |
6. | 2527 | 0 | 136 | 0 | 0 | 0 | 0 |
7. | 0 | 0 | 0 | 0 | 0 | 0 | 0 |
8. | 2928 | 0 | 136 | 0 | 0 | 0 | 0 |
<Quit> | <Reset | All> | <Previous Page> | <Next Page> | |||
| Configure | the action | menu. |
|
| ||
Arrow/TAB/BKSPC = Move Item | Quit | = Previous | menu | Enter = Select Item | |||