2.048Mbps Wireless Modem
Each column represents the percent of RADIO ERROR BUFFERS in each of the RF channels, out of all the buffers that were transmitted on the channel. A
Clear System Counters and Channel Tracer
In the Counters and Tracers menu, type 4 to clear the Systems Counters and the information accumulated in the Channel Tracer graphs.
The System Counters and Channel Tracer graphs display information accumulated since the last time they were cleared.
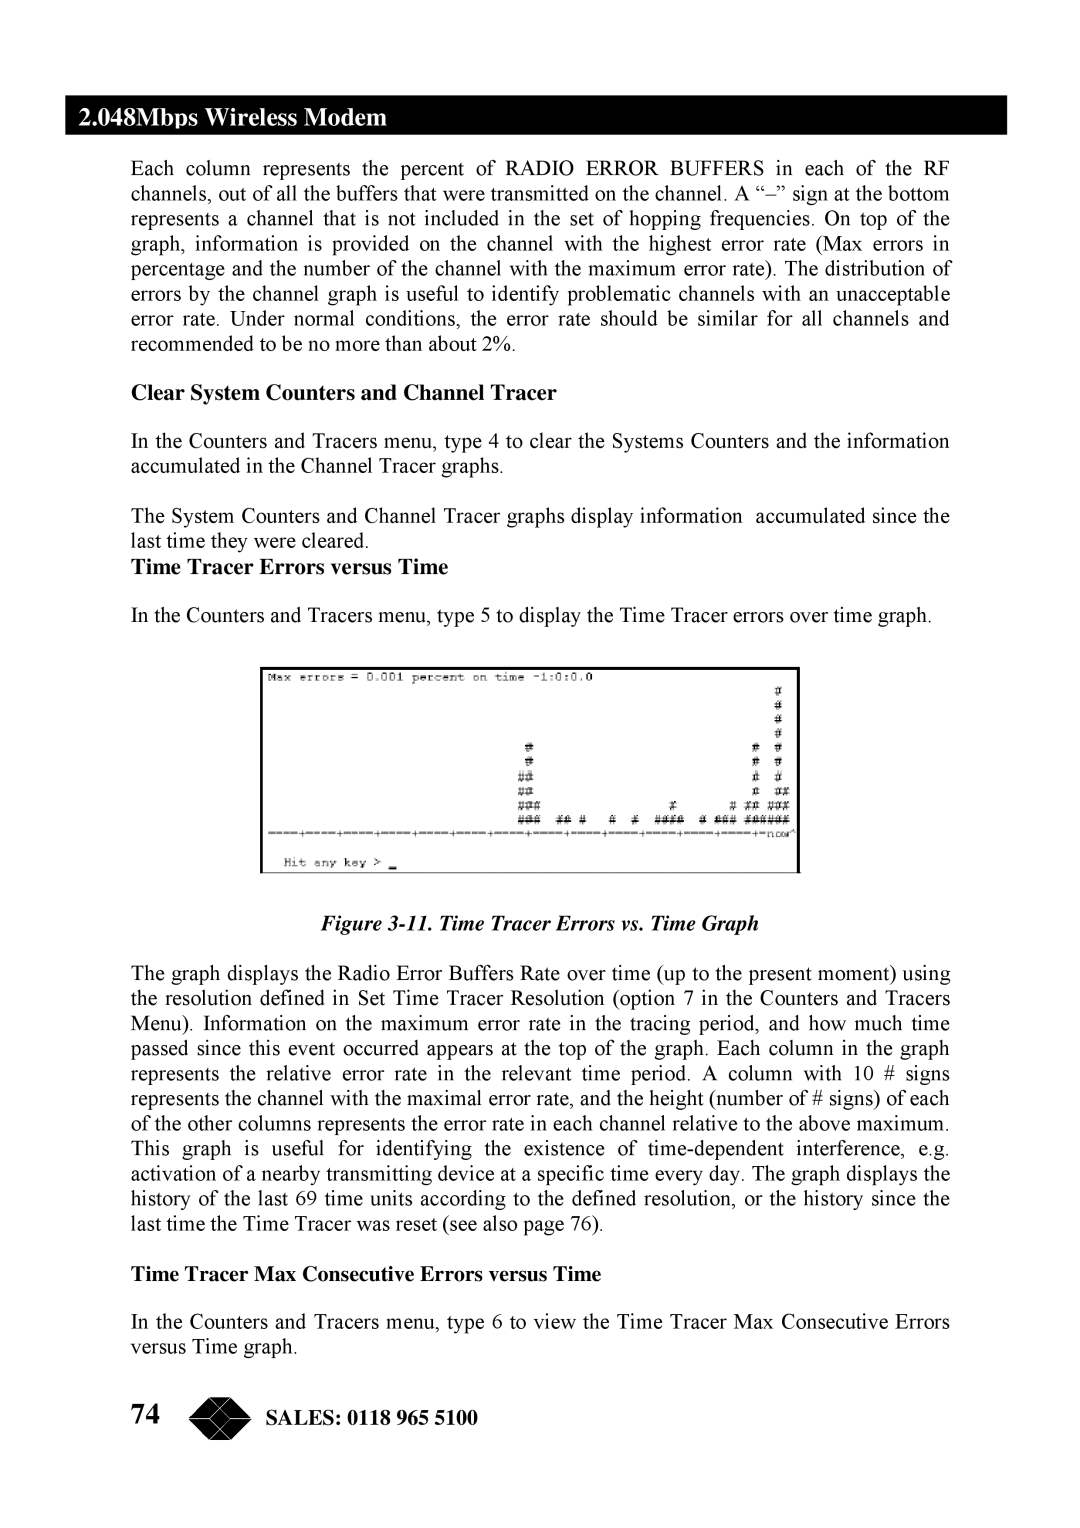
Time Tracer Errors versus Time
In the Counters and Tracers menu, type 5 to display the Time Tracer errors over time graph.
Figure 3-11. Time Tracer Errors vs. Time Graph
The graph displays the Radio Error Buffers Rate over time (up to the present moment) using the resolution defined in Set Time Tracer Resolution (option 7 in the Counters and Tracers Menu). Information on the maximum error rate in the tracing period, and how much time passed since this event occurred appears at the top of the graph. Each column in the graph represents the relative error rate in the relevant time period. A column with 10 # signs represents the channel with the maximal error rate, and the height (number of # signs) of each of the other columns represents the error rate in each channel relative to the above maximum. This graph is useful for identifying the existence of
Time Tracer Max Consecutive Errors versus Time
In the Counters and Tracers menu, type 6 to view the Time Tracer Max Consecutive Errors versus Time graph.
74 | SALES: 0118 965 5100 |