2.048Mbps Wireless Modem
The RSSI per channel test displays in graphic format the strength of the received signal on each of the RF channels used by the 2.048Mbps Wireless Modem. Each vertical column represents the level of the received RF signal on one of the channels. Available channels are from 0 to 100 (0 representing 2.400GHZ and 100 representing 2.500GHz), depending on hopping sequence setting.
Note: In the diagram, 1 represents channel number 10, 2 represents channel 20, and so on; channels 5, 15 and so forth are marked as +, while the other channels are marked as =.
The height of the column (# signs) represents the relative signal strength. At the top of the graph the maximum and minimum RSSI levels are given in dBm. An empty column indicates that this is the channel(s) with the minimal RSSI (channel 47 in the example above). A column with a – sign at the bottom (channel 39 in the example above) represents a channel that is either blocked or is not included in the hopping sequence
Note: This graph is used only for measuring an operational link. Note that it measures the received energy in the band, including possible emissions from other sources. See page82 for further information on measuring the energy received from undesired sources.
For good fade margin, RSSI levels should allow for at least a 10 dB margin above the minimal level, determined by the sensitivity at the applicable rate. The following table provides the RSSI levels required for 10dB fade margin:
Table 3-16. RSSI Levels
Note: The maximum RSSI level must not exceed
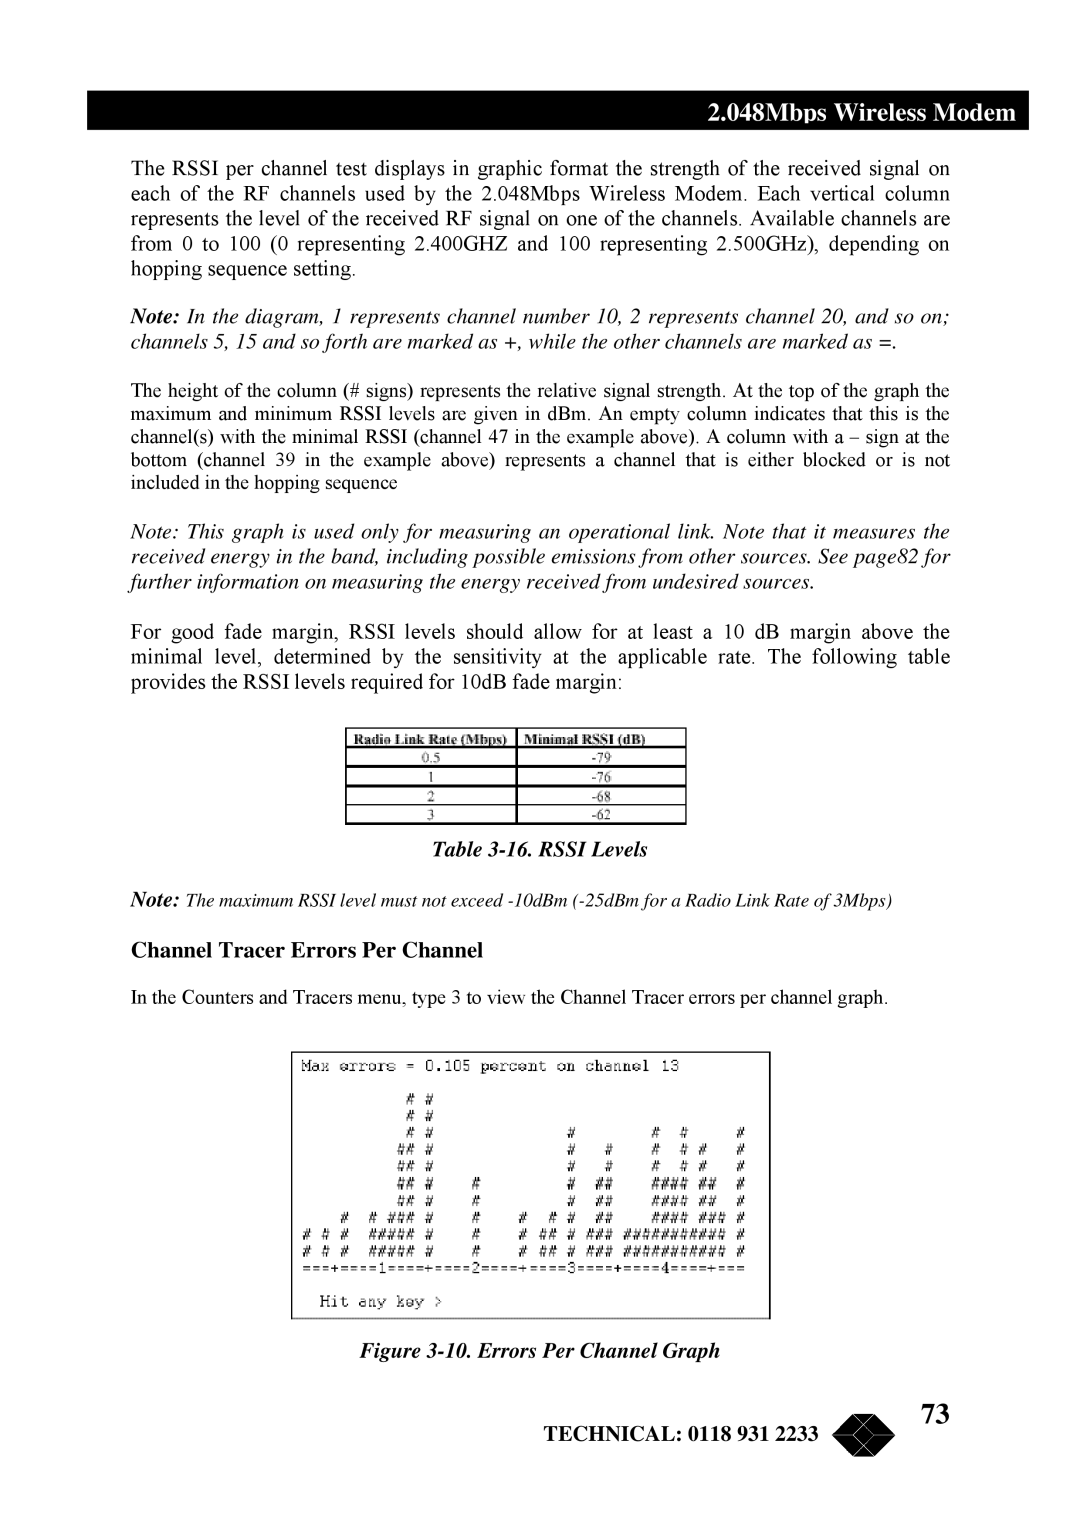
Channel Tracer Errors Per Channel
In the Counters and Tracers menu, type 3 to view the Channel Tracer errors per channel graph.
Figure 3-10. Errors Per Channel Graph
TECHNICAL: 0118 931 2233
73