Surveyor
Trademarks and Copyrights
Finisar Software License Agreement
License
Term
Limited Software Warranty
Restricted Rights Legend
Patent and Copyright Indemnification
Limitation of Liability
Customer Support Phone
Customer Support FAX
Internet Address
World-Wide Web Mailing Address
Table of Contents
Configuring Surveyor
Surveyor
Resources and Modes
Views
Transmit Specification
Capture and Display Filters
Alarms
10-1
10-15
10-58
10-102
Multi-QoS 11-1
12-1
13-1
Counters
Utilities
Implementation Profile
Pre-Defined Filter Templates
Keyboard Shortcuts
Parser Names
List of Figures
10-1
List of Tables
Application Layer Host Table View, Table Column Descriptions
11-21 11-8
Surveyor
Introduction
Surveyor Functions
Surveyor Functions
Function Description
Introduction
Analyzer Devices
Protocols Supported
Finisar Analyzer Devices
Finisar Device Description
XNS
AppleTalk Phase2
DECnet Phase
Oracle Suite IPX/SPX Suite
Banyan Vines Suite
IBM ISO
Whats New in Release
Capture to Disk and THGsE Analyzer Support
Disk Caching
Capture Management
Expanded Multi-QoS Support
Smnp Extended Agent
New and Enhanced Protocol Decodes
Surveyor
System Requirements
System Requirements
RAM
PII
Upgrading Surveyor
Supported Analyzer Cards and Network Adapter Cards
Desktop PC
Installing Surveyor
Installing Analyzer Hardware
Installing Analyzer Hardware in a Desktop PC
Installing the THGm, Windows NT
Installing THGm, Windows 2000/XP
Installing Analyzer Hardware in a Notebook PC
Cdrom
Installation
Installing More Than One Analyzer Card in a Notebook PC
Compatibility Matrix
Hardware/Software Compatibility Matrix
Surveyor
Surveyor System
Launching Surveyor
Default Account Names, Passwords and Privileges
Basic Navigation Tips
Surveyor
Getting Started
Buttons and Toolbars
Surveyor Toolbar
Module Toolbar Summary View
Buttons and Toolbars
Detail View Toolbar
Getting Started
Data Views Toolbar
Getting Started
Surveyor
Filter Design Toolbar
Filter States Design Toolbar
Design window
Surveyor
Capture View Toolbar
Surveyor
Getting Started
File Formats
Providing a Name Table to Surveyor
Establishing Links for THGm
Configuring the Interface
Customizing Views and Windows
Docking Windows
Capture View Display Options
Configuring Surveyor
Setting Histogram Colors
Histogram Options
Setting Histogram Zoom Factor
Setting the Histogram Download Size
Setting the Monitoring View for a Module
Choose Monitor View Preferences
Configuring Chart Views
Table Views
Module Settings Properties
Hardware Device Properties
Default Module Settings
Module Setting Default Values
Buffer Size
Packet Slice Slicing Size
Expert Analysis Mode
Non-Well-Known-Ports Mode
Stop-and-Save Capture Buffer
Modes
System Settings
Monitor M-QoS Only Mode
Configuring Ports to Scan
WKP4620
Configuring Remote Communications
RSP Time Out value
Setting Update Timers
Protocol Color Coding
Default Display Timer Settings
Display Timer Default Value
Disk Options
Cache File Location
Disk Capture Location
Configuring Alarms
Configuring Counter Logging
History Log File Settings and Default Values Log Setting
Mmddhhmm.ss Mmmonth ddday hhhour mmminute sssecond
Configuring a Multi-Port Tap or Switch
Configuring a Multi-Port Tap or Switch
Settings for Analyzer Devices
Setting the Local COM Port for Taps and Switches
Connecting a Tap with THGs or THGsE
Resetting an Analyzer Device
Click the Reset Host/Image Upgrade button
Updating an Analyzer Device
Advanced Configuration
Customizing Expert Diagnostic Information
Surveyor.ini File
Assigning Names to Protocols Monitor
MONITOR.INI Format
Mapping= port num,short name,long name
Port num
Short name
Long name
MONITOR.INI Examples
Mapping=921,CXP,Company X Protocol
Mapping=6063, XWIN6063,X Windows on port
Mapping=2900,VIDEO,Video Audio Network Communicator
How Surveyor Assigns Protocol Names
Monitoring Well-Known Ports
11. Default Names for Non-WKP TCP Ports
12. Default Names for Non-WKP UDP Ports
Monitoring Non Well-Known Ports
Name TCP port values
Assigning TCP or UDP Ports to Protocol Parsers
Mapping=port num,ip addr,parser name,name Port num
Ip addr
Parser name
Parser Names
Surveyor
Resources and Modes
Resource Browser
Remote Resources
Surveyor
Software
Naming Remote IP Resources Aliases
Host Properties Dialog Box for Establishing an Alias
Resource Protection
Remote User Privileges
Privilege Description
Settings option from the Module
Modes
Hardware Devices
Surveyor Resource Modes Description Resource Type
Hardware Device Capabilities
Synchronized Resources
Hardware Device Capabilities
Ndis
Hints and Tips for Resources
Surveyor
Views
Static Data
Summary View
Module Window Tabs Within Summary View
Tab Description/Action
Detail View
Vlan
Detail View
Using Capture + Monitor Mode in Detail View
Capture View
Capture View Window
Summary Pane
Configuring the Capture View Display
Creating Filters from Capture View
Exporting and Printing Decodes
Display Options
Histogram Options
Other Options
Histogram Color Coding
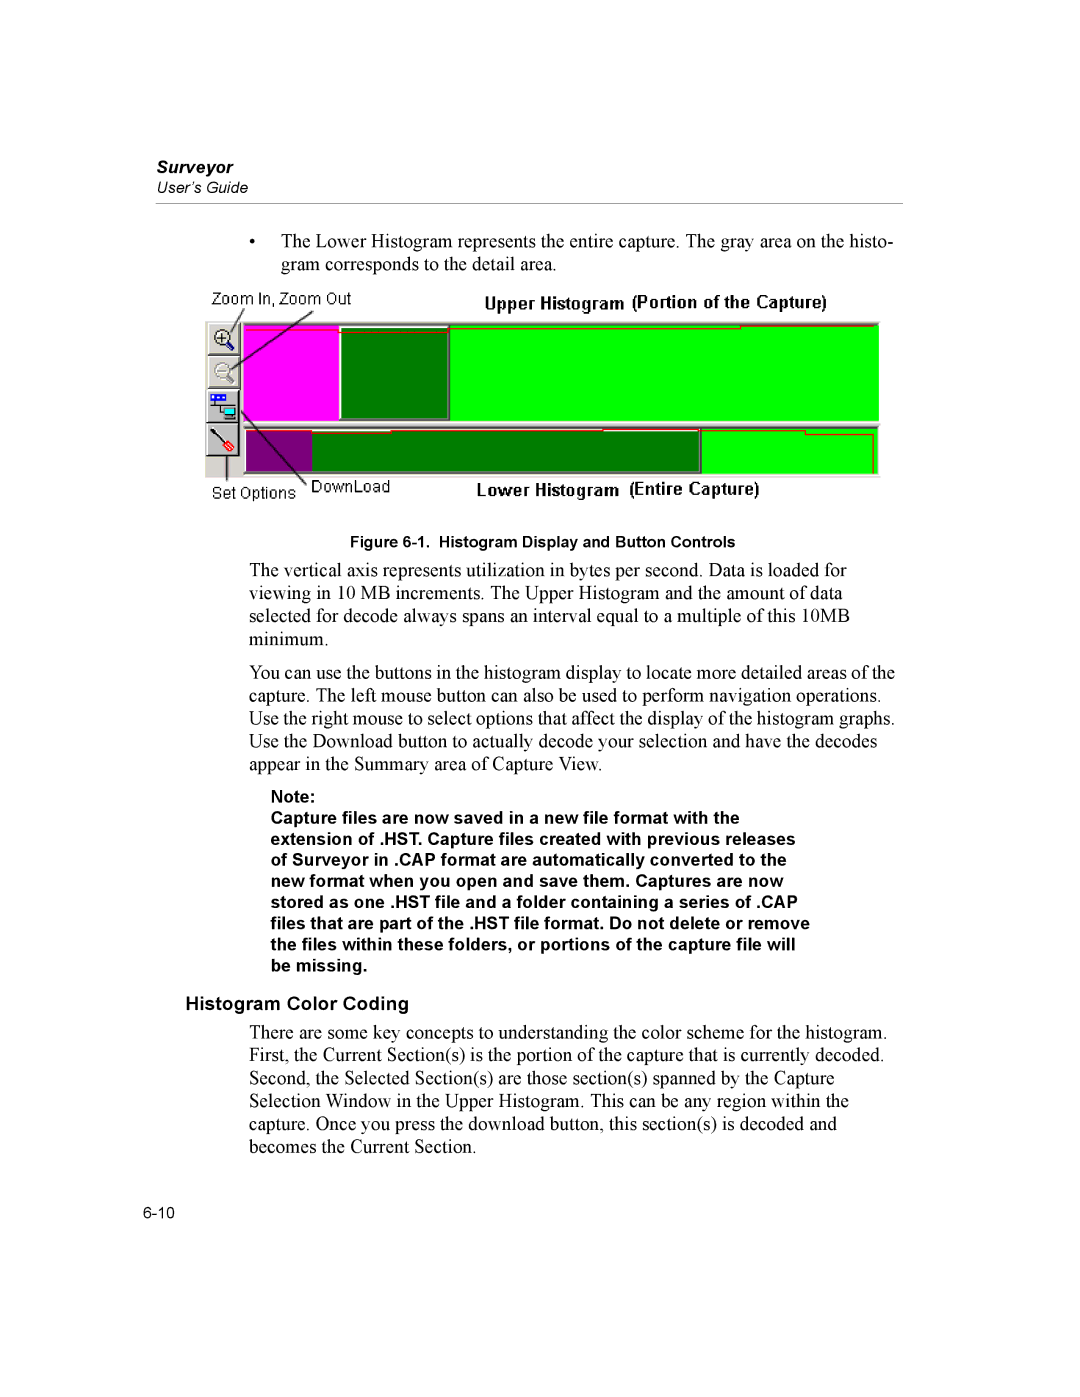
Histogram Display and Button Controls
Views
Histogram Display Showing Colors
Histogram Default Colors
Histogram Display, Large Capture Example
Histogram Button Controls
Histogram Mouse Controls
Sizing/Selecting Areas with the Mouse
Right Mouse Options in the Histogram
Saving Portions of the Data
Line Graph or Stair Step
Linear Scale or Logarithmic Scale
Packet Editor
Resume Analysis
Packet Editor Buttons
Button Description/Action
Data Views
Editing in Decode View
Editing in Hex View
Ring Statistics View Token Ring Only
MAC Statistics View Rx
MAC Statistics View Capture
MAC Statistics View Tx
Frame Size Distribution View
Chart
Protocol Distribution View
Protocol Distribution View, Chart Buttons Protocols
Chart Button Description/Action
Protocol Distribution View, Chart Buttons Packets
NET
Utilization/Error View
Protocol Distribution View, Graph Type Buttons
Display Button Description/Action
10. Protocol Distribution View, Table Column Descriptions
Host Table View
11. Host Table View, Table Column Descriptions
Network Layer Host Table View
12. Network Layer Host Table View, Table Column Descriptions
Application Layer Host Table View
Host Matrix View
14. Host Matrix View, Table Column Descriptions
Network Layer Matrix View
15. Network Layer Matrix View, Table Column Descriptions
Application Layer Matrix View
16. Application Layer Matrix View, Table Column Descriptions
Vlan
Vlan View
Address Mapping View
17. Vlan View, Table Column Descriptions
Table Column Description
Duplicate Address View Expert plug-in only
18. Address Map View, Table Column Descriptions
19. Duplicate Address View, Table Column Descriptions
Vlan ID
Expert View Expert plug-in only
Application Response Time View Expert plug-in only
Multi-QoS View Multi-QoS software only
Hints and Tips for Using Views
Surveyor
Getting Started with the Filter Interface
Press the Create/Modify Capture Filter
Filter Design window
Creating Filters with Filter Templates
Available Filter Templates box
Add Port Numbers to Custom Filter Templates
Sample Filter Design window is shown below
Creating and Applying a Conversation
Protocol and Frame Type
Station Addresses
ISL, Q+EV2
Traffic Direction Indicator
Apply Conversation to Template Check Box
Creating and Applying a Port Number
Selecting Filter Templates
Defining Port Numbers
Conversation Element Description
Multiple Byte Patterns in Filter Templates
Creating Custom Filter Templates
Custom Templates Based on Pre-Defined Templates
Custom Templates Based on Specification of Byte Patterns
Entering Values that Cross Byte Boundaries
Bit-Level Filtering
Filter Creation
Creating Filter Template Combinations
Filter Actions
Operator Buttons for Template Combinations Description
Not
Template Combination box
Actions for Capture Filters
Capture Filter Actions
Action Description
Packets until the buffer is %% full field
Actions for Display Filters
Counter Conditions for Filters
Display Filter Actions
Global Values that Affect Capture Filter Actions
Frame Types
Capture Filter Global Values
Capture Filter Global Description
Multi-State and Multi-Statement Filters
Frame types are shown in Table
Example Filter States Design Window
Filter Structure
Filter States
Changing States Changing Filter Operation
GoTo Current State
Filter Statements
Capture and Display Filter Differences
Activating Display Filters
Activating Capture Filters
Filter Examples
Filter Example, Capture Conversation
Surveyor
Filter Example, Template Combination
Filter Design Window, Template Combination Example
Surveyor
Filter Example, Capture TCP Port Traffic
Filter Design Window, Capture TCP Port Example
Surveyor
Filter Example, Advanced Filter
Advanced Filter, Filter States Design Window
Rules of the Capture or Display Filter
Hints and Tips for Using Filters
Filtering Tips Unique to THG-class Devices
Transmit Specification
Transmit Specifications
Transmit Specification Dialog Box
Defined Streams List Box
Radio Buttons and Fields for Defining a Stream
Transmission Mode and Status Controls
Transmit Specification Control Buttons
Stream Buttons
Stream Function Buttons
Transmit Specification Control Buttons
Control Button Transmit Specification Function
Repeating Frames
Surveyor
Stream Mode Rate Setting
Stream Modes
Bursts
Stream Modes
Transmission Mode
Specifying Transmit Data
Packet Editor
Changing Fields Directly in the Dialog Box
Packet Editor Button Editing Function
DA and SA Fields
Packet Type
Packet Size
Data Field
Using Templates
Creating Templates
Transmit Specification Examples
Transmitting Capture Files
Transmit Specification Example, Packet Gaps
Transmit Specification Example, Bursts
Transmit Specification Dialog Box, Bursts
Hints and Tips for a Transmit Specification
Surveyor
Alarms
Current Module Alarms
Current Module Alarms
Alarms
Alarm Editor
Alarm Editor Description
Mqos
Multi-QoS Alarms
Expert Alarms
Transport Layer
Data Link Layer, Ethernet
Using Alarms with Different Devices
YES
Thresholds and Alarms
Alarm Actions
Alarm Actions Description Support by Host Type
Log File Settings
Mail Settings
Alarm Actions
Settings
Pager Settings
Snmp Trap Settings
Trap Settings for THGs
Trap Settings for Surveyor Hosts
Viewing the Alarm List and the Alarm Log
Hints and Tips for Alarms
Alarm Examples
Alarm Example, Utilization
Alarm Example, MAC Errors
Alarm Example, MAC Errors
Alarm Example, Frame Size
Alarm Example, Frame Size
Alarm Example, VoIP Calls
Alarm Example, Call Jitter and Call Setup Time
Alarm Example, Expert and Application Response
10. Alarm Example, Expert and Application Response
Surveyor
Expert Features
Expert System Views
Getting Started with Expert View
Application Response Time View
Duplicate Network Address View
Expert Features
Expert Overview Details
Expert Overview Detail Table Example
Expert Layers
Layer Description
Expert Application Layer Example
10-8
Expert Symptoms and Analyses by Layer Expert Analyses
Expert Symptoms, Analyses, and Network Entities
Symptoms
Tables in the Detail Area for Symptoms
Analyses
Tables in the Detail Area for Analyses
Entities
Entities for the Transport Layer Example
Application/Session Lists for Entities
Transport Lists for Entities
Network Lists for Entities
Data Link Lists for Entities
Expert Diagnostic Messages
Expert Diagnosis Example
Configuring the Expert System
Working with the Expert System
Module Settings for the Expert System
Setting Expert Alarms
Exporting Expert Data
Printing Expert Data
Working with Timestamps
Application Response Time
Working with Analyzer Devices
Application Layer
Excessive Mailslot Broadcasts
Rate of change of SMB Mailslot Broadcasts=40
FTP Login Attempts
Expert Symptom
Login attempts=4
Missed Browser Announcement
Time passed since last announcement=4000 ms 3000 ms
NCP File Retransmission
Between 00000010.0207012303E3 and 302A9950.000000000001
NCP Read/Write Overlap
NCP Request Denied
Requests denied within 100 ms=5
NCP Request Loop
Loops on same request in 100 ms
NCP Server Busy
Rate of change of NCP Server Busy=5
NCP Too Many File Retransmissions
File retransmission ratio is 8 / 28 = 28%
NCP Too Many Requests Denied
Requests denied ratio is 8 / 28 = 28%
NCP Too Many Request Loops
Requests loops ratio is 8 / 28 = 28%
NFS Retransmissions
No Http Post Response
Http Post request not responded
No Server Response
Smtp server not responded
Slow Http GET Response
Slow Http GET response=3608 ms 2000 ms
Slow Http Post Response
Slow Http Post response=2918 ms 2000 ms
Slow Server Connect
Slow FTP server connect=298 ms 200 ms
Slow Server Response
Slow Smtp server response=1258 ms 1000 ms
SMB Invalid Network Name
Invalid network name in tree connect
SMB Invalid Password
Invalid password
Session Layer
No Wins Response
Wins request not responded within 1000 ms
TNS Slow Server Connect
Slow TNS server connect=298 ms 200 ms
TNS Slow Server Response
Slow TNS server response=238 ms 200 ms
Transport Layer
Idle Too Long
Non Responsive Station
Station 206.250.228.11 not responding
TCP Checksum Errors
SA=206.250.228.69 DA=206.250.228.11
TCP Fast Retransmission
TCP Frozen Window
10-48
TCP Long Ack
TCP Repeat Ack
Acknowledgement number is less than the one before
TCP Retransmissions
TCP RST Packets
TCP SYN Attack
Rate of change of TCP SYN’s=150
TCP Window Exceeded
Count
Data length of 128 bytes exceeds last window size
TCP Window Probe
Between 206.250.228.69/TCP/IP WKP1988 206.250.228.11/SMTP
TCP Zero Window
Expert Diagnosis
Too Many Retransmissions
Retransmission ratio is 49 / 50 = 98%
Network Layer
Duplicate Network Address
Addr=206.250.228.67
Hsrp Coup
SA=206.250.226.11 DA=206.250.228.69
Hsrp Errors
Hsrp Resign
Icmp All Errors
Parameter Problem
Destination Unreachable
Source Quench Redirect
Icmp Bad IP Header
Icmp Destination Host Access Denied
Cannot be reached by SA=206.250.228.11 DA=206.250.228.69
Icmp Destination Host Unknown
Icmp Destination Network Access Denied
Icmp Destination Network Unknown
Icmp Destination Unreachable
10-69
Icmp Fragment Reassembly Time Exceeded
Icmp Fragmentation Needed D/F set
Icmp Host Redirect
Icmp Host Redirect for TOS
Icmp Host Unreachable
Icmp Host Unreachable for TOS
Icmp Inconsistent Subnet Mask
Addr=206.250.228.69. Subnet mask=255.255.255.240
Icmp Network Redirect
Icmp Network Redirect for TOS
Icmp Network Unreachable
Icmp Parameter Problem
Icmp Port Unreachable
Icmp Protocol Unreachable
Icmp Redirect
Icmp Required IP Option Missing
Icmp Source Quench
Icmp Source Route Failed
Icmp Time Exceeded
Icmp Time to Live Exceeded
Illegal Network Source Address
Addr=255.255.255.255
IP Checksum Errors
IP Time to Live Expiring
TTL=1 SA=206.250.228.69 and DA=206.250.228.11
ISL BPDU/CDP Packets
ISL Illegal Vlan ID
Vlan ID=1036
Ospf Broadcasts
RIP Broadcasts
Router Storm
Rate of change of Router Broadcasts=5
Same Network Addresses
Addr=255.23.252.6
SAP Broadcasts
Total Router Broadcasts
Unstable MST
Rate of change of Topology=10
Zero Broadcast Address
Addr=0.0.0.0
MAC Layer
Bad Frames
Broadcast/Multicast Storms
Rate of change of Bcast/Mcast Packets=500
CRC error with more than 63 bytes
CRC Frame counter
Excessive ARP
Rate of change of ARP Requests=20
Excessive Bootp
Rate of change of Bootp/Dhcp Requests=25
Excessive Broadcasts
Excessive Collisions
Excessive Multicasts
CRC error with less than 64 bytes
Fragment Frame
Illegal MAC Source Address
Addr=FFFFFFFFFFFF
CRC error with more than 1518 bytes
Jabber Frame
Network Overload
Utilization=42%
New MAC Stations
Oversized Frame
Oversized frame has more than 1518 bytes
Overload Frame Rate
Overload Utilization Percentage
Physical Errors
Rate of change of Errors=450
Runt Frame
Runt frame has less than 64 bytes
Same MAC Addresses
Addr=00800F13A65B
Total MAC Stations
Hints and Tips for Expert Features
Summary of Expert Counters and Symptoms
Response Time Alarm editor
Configuration dialog box
Summary of Expert Features
Summary of Expert Features
TOS
ISL BPDU/CDP
Surveyor
TCP RST
Surveyor
Multi-QoS
Using Multi-QoS with Analyzer Hardware
Protocols Supported by Multi-QoS
Multi-QoS User Interface Overview
Call Summary Range Table
All Calls Table
Channel View Table
Surveyor and Rtcp Jitter Values
Summary Range Graphs
Call Tables for a Specific Range
Call Details for a Single Call
Configuring Multi-QoS
Multi-QoS Configuration
Alarm Log Monitor Only
Protocol Type Timeout Value
Refresh Options MQoS Window Management
Multi-QoS Performance Optimization
Call Filtering with Multi-QoS
All Calls Table
H323
Red Phone
Field Descriptions for All Calls Table
All Calls Table Field Descriptions
Call Jitter, Call Rtcp Jitter, Call Setup Time
Call Range Graphs and Summaries
Multi-QoS Configuration, Call Jitter Ranges
Dropped Packets, Rtcp Dropped Packets
Multi-QoS Packets Dropped Graph Example
Multi-QoS Configuration, Packets Dropped
Field Descriptions for Call Range Summaries
Call Range Summary Field Descriptions
VQMon Metrics
Multi-QoS R-factor Example
Multi-QoS Configuration, R-factor Ranges
Ranges for R-factors Network R-factor User R-factor
Utilization Graph
10. Multi-QoS Utilization Graph Example
Field Descriptions for Call Details
11. Example Call Details Window H.323
Sccp Call Field Descriptions
FID
H.323 Call Field Descriptions
Field Name Description
SIP Call Field Descriptions Field Name
Channel Table Details
10. Unknown Call Field Descriptions
12. Channel Table Example
11. H.323, SIP, or Unknown Channel Table Column Descriptions
Multi-QoS
12. Sccp Channel Table Column Descriptions
Filtering on Single Channels
Call Playback
Playback PCMU/PCMA Data
Customizing Multi-QoS Table Displays
Customizing All Calls or Range Summary Tables
Customizing Channel Tables
14. Multi-QoS Channel Table View Options, Sccp Example
Exporting Multi-QoS Data
Exporting All Multi-QoS Data to CSV Format
Choose Export Multi-QoS Data... from the File menu
Exporting a Single Multi-QoS Table to CSV Format
11-34
Packet Counters
MAC Layer Counter Types
Counter Type Description
Error Counters
Custom Counters
Counters
Last frame received
Expert Counters
Network Unknown, Destination Host Unknown, Destination Net
Overload Utilization Percent
Surveyor
Multi-QoS Counters
Counter Log File Overview
Log Directory Structure
Utilities
Name Table Utility
Utilities
Building a Name Table From the Network
NIS-to-Name Table Conversion Utility
NIS2NAM output-name-table
Sniffer Translator Utility
Internet Advisor Translator Utility
Get Version Information Utility
Sniffer Translator Utility, Tool Menu Options
Convert Capture Files to Histogram Files
Merge Histogram Files
From the Tools menu, choose Merge Histogram Files
Extract Frames From a File Using a Filter
Logging Utilities
Export Utilities
Exporting Packets
Exporting Tables to CSV Format or Graphs to a Bitmap
Exporting to Optimal CSV Format
Exporting Counter Log Files to Excel
Choose Export to Optimal Performance from the File menu
13-11
13-12
Buffers
How Resources Use Buffers
Table A-1. Buffer Types Used By Surveyor
Buffer Type Description
Table A-2. Resource Use of Buffers
Resource Buffer Usage
Hardware Dependencies
Table A-3. Hardware Real-Time Functions
Table A-4. Hardware Transmit Functions
Table A-5. Hardware Capture Functions
Table A-6. Hardware Connectivity
About Ndis Mode
Captured Packets
Capture Rate / Transmit Speed
Counters
Ndis Configuration Options
Setting the Interface
Set Capture Buffer and Packet Slicing Size
Pre-Defined Filter Templates
Filter Templates
ARP
Macdabroadcast
HEX Fffffffffff
Macdamulticast
Eigrp
Icmp
Igmp
DEC
RIP IPX
Rsvp
SAP IPX
DNS TCP
FTP
Http
Imap
Sccp
Smtp
TCP
Telnet
Dhcp
DNS UDP
Mgcp UDP
NB-DATAGRAM
NTP
RIP UDP
SIP
Snmp
Dsap
HEX
HEX F0F0
HEX E0E0 Nmpi
Snap
HEX AAAA03
Snaparp
Snapcdp
Islarp
Isldns TCP
Isleigrp
Islftp
Islldap
HEX Ffffffffffff
HEX 01005EFFFFFF
Islmgcp TCP
Islsmtp
Islssp
Isltcp
Isltelnet
HEX 0C
HEX 0D
HEX 0B
HEX 2A
HEX 0E
HEX 0F
Nonmac
Keyboard Shortcuts
Function Keys
Standard and Navigational Keys
Keyboard Shortcuts
Surveyor
Recognized Parser Names
Table D-1. Parser Names, DLC Suite
Parser Name Protocol
Table D-2. Parser Names, Applications and Others
Table D-3. Parser Names, Apple Talk Suite
Parser Name Protocol Name
Table D-4. Parser Names, Banyan Suite
Table D-5. Parser Names, Cisco Suite Protocol Name
Table D-6. Parser Names, DECnet Suite Protocol Name
Table D-7. Parser Names, Fujitsu Suite Protocol Name
Table D-8. Parser Names, IBM Suite
Table D-9. Parser Names, Internet Suite
Table D-9. Parser Names, Internet Suite Protocol Name
Table D-10. Parser Names, Internet Next Generation Suite
Table D-11. Parser Names, Netware Suite
Table D-12. Parser Names, PPP Suite Protocol Name
Table D-13. Parser Names, XNS Suite Protocol Name
Table D-14. Parser Names, H.323 Suite
Table D-15. Parser Names, ITU Codecs
Table D-17. Parser Names, Other Multimedia Protocol Name
Table D-18. Parser Names, Intel Suite Protocol Name
Table D-19. Parser Names, VPN Suite Protocol Name
Surveyor
Glossary
Alarm Browser
Avvid
Capture Mode
Dram
Expert View
Log Files
Ndis
NIS
Pause
Sccp
Token Error
Transmit Specification
WKP
Index
Index-2
Index
Index-4
Index-5
Index-6
Index-7
Index-8
Index-9
Index-10
Index-11
Index-12
Index-13
Index-14