| Generating Reports | 75 |
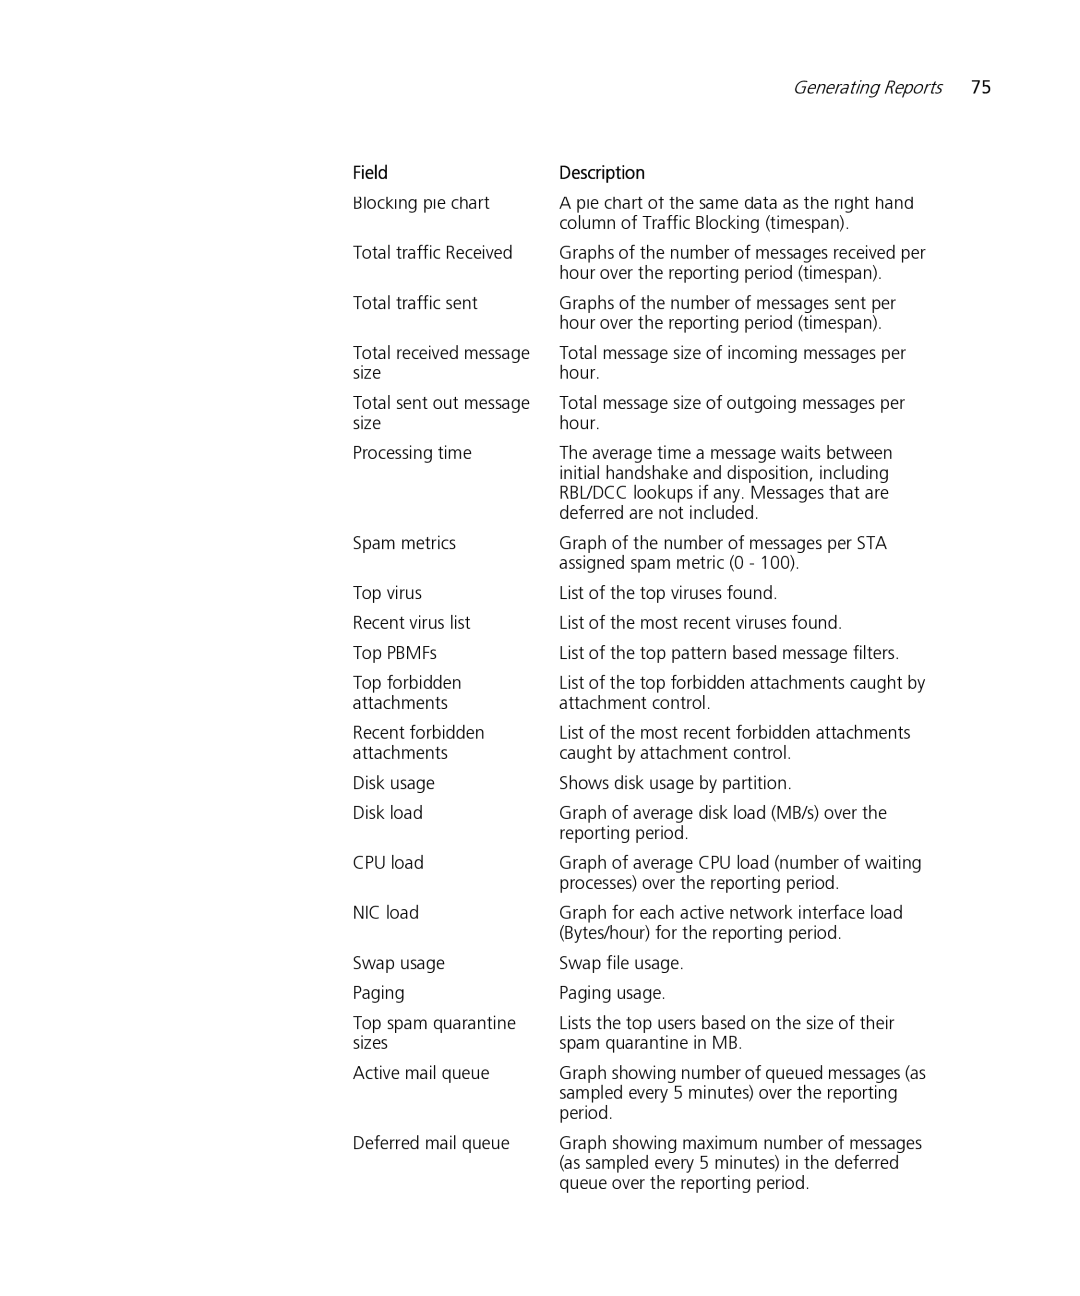
Field | Description |
|
Blocking pie chart | A pie chart of the same data as the right hand |
|
| column of Traffic Blocking (timespan). |
|
Total traffic Received | Graphs of the number of messages received per |
|
| hour over the reporting period (timespan). |
|
Total traffic sent | Graphs of the number of messages sent per |
|
| hour over the reporting period (timespan). |
|
Total received message | Total message size of incoming messages per |
|
size | hour. |
|
Total sent out message | Total message size of outgoing messages per |
|
size | hour. |
|
Processing time | The average time a message waits between |
|
| initial handshake and disposition, including |
|
| RBL/DCC lookups if any. Messages that are |
|
| deferred are not included. |
|
Spam metrics | Graph of the number of messages per STA |
|
| assigned spam metric (0 - 100). |
|
Top virus | List of the top viruses found. |
|
Recent virus list | List of the most recent viruses found. |
|
Top PBMFs | List of the top pattern based message filters. |
|
Top forbidden | List of the top forbidden attachments caught by |
|
attachments | attachment control. |
|
Recent forbidden | List of the most recent forbidden attachments |
|
attachments | caught by attachment control. |
|
Disk usage | Shows disk usage by partition. |
|
Disk load | Graph of average disk load (MB/s) over the |
|
| reporting period. |
|
CPU load | Graph of average CPU load (number of waiting |
|
| processes) over the reporting period. |
|
NIC load | Graph for each active network interface load |
|
| (Bytes/hour) for the reporting period. |
|
Swap usage | Swap file usage. |
|
Paging | Paging usage. |
|
Top spam quarantine | Lists the top users based on the size of their |
|
sizes | spam quarantine in MB. |
|
Active mail queue | Graph showing number of queued messages (as |
|
| sampled every 5 minutes) over the reporting |
|
| period. |
|
Deferred mail queue | Graph showing maximum number of messages |
|
| (as sampled every 5 minutes) in the deferred |
|
| queue over the reporting period. |
|
Page 75
Image 75