Managing HyperFabric
Displaying Status and Statistics
============================================================================
•Example 2
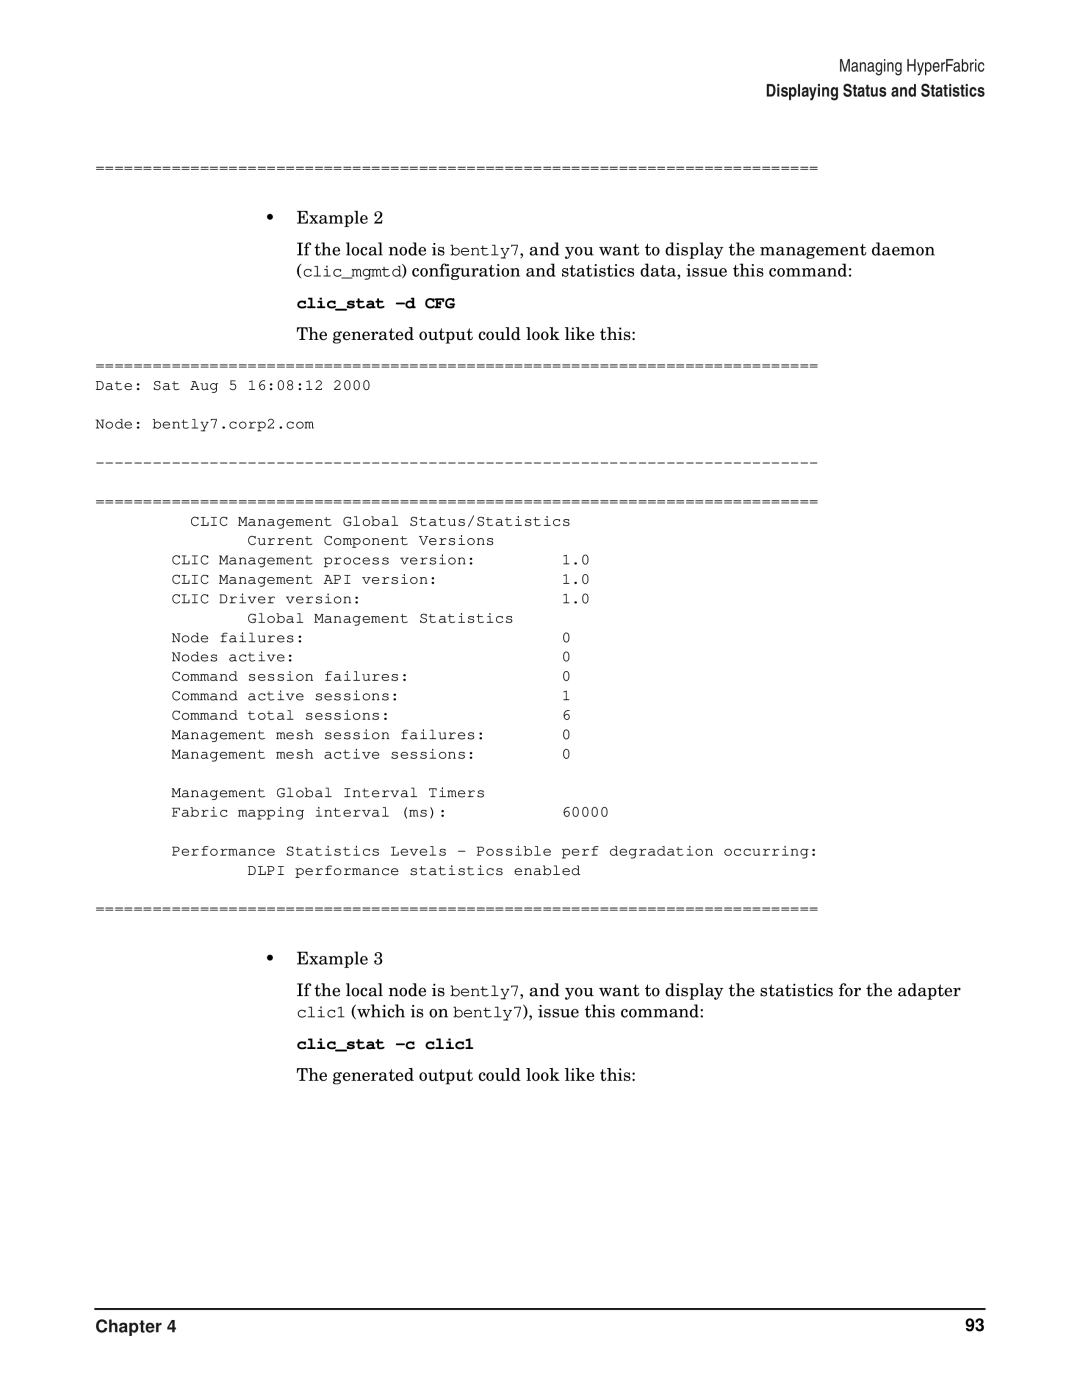
If the local node is bently7, and you want to display the management daemon (clic_mgmtd) configuration and statistics data, issue this command:
clic_stat -d CFG
The generated output could look like this:
============================================================================
Date: Sat Aug 5 16:08:12 2000
Node: bently7.corp2.com |
|
|
============================================================================ | ||
CLIC Management Global Status/Statistics | ||
Current | Component Versions |
|
CLIC Management | process version: | 1.0 |
CLIC Management | API version: | 1.0 |
CLIC Driver version: | 1.0 | |
Global Management Statistics |
| |
Node failures: |
| 0 |
Nodes active: |
| 0 |
Command session | failures: | 0 |
Command active sessions: | 1 | |
Command total sessions: | 6 | |
Management mesh | session failures: | 0 |
Management mesh | active sessions: | 0 |
Management Global Interval Timers |
| |
Fabric mapping interval (ms): | 60000 | |
Performance Statistics Levels - Possible perf degradation occurring:
DLPI performance statistics enabled
============================================================================
•Example 3
If the local node is bently7, and you want to display the statistics for the adapter clic1 (which is on bently7), issue this command:
clic_stat -c clic1
The generated output could look like this:
Chapter 4 | 93 |
