Histogram

The histogram is shown once you have clicked on the button PR E V I E W .

The x-axis represents the spread of each color, or its respective brightness values, while the y-axis displays the frequency of occurrence of each RGB-value. So the x-axis goes from black to white, with values of low intensity on the left, and values of higher intensity on the right.

The arrow keys allow you to rescale the histogram.

The check boxes on the left side of the histogram allow you to activate or deactivate the single color bars.

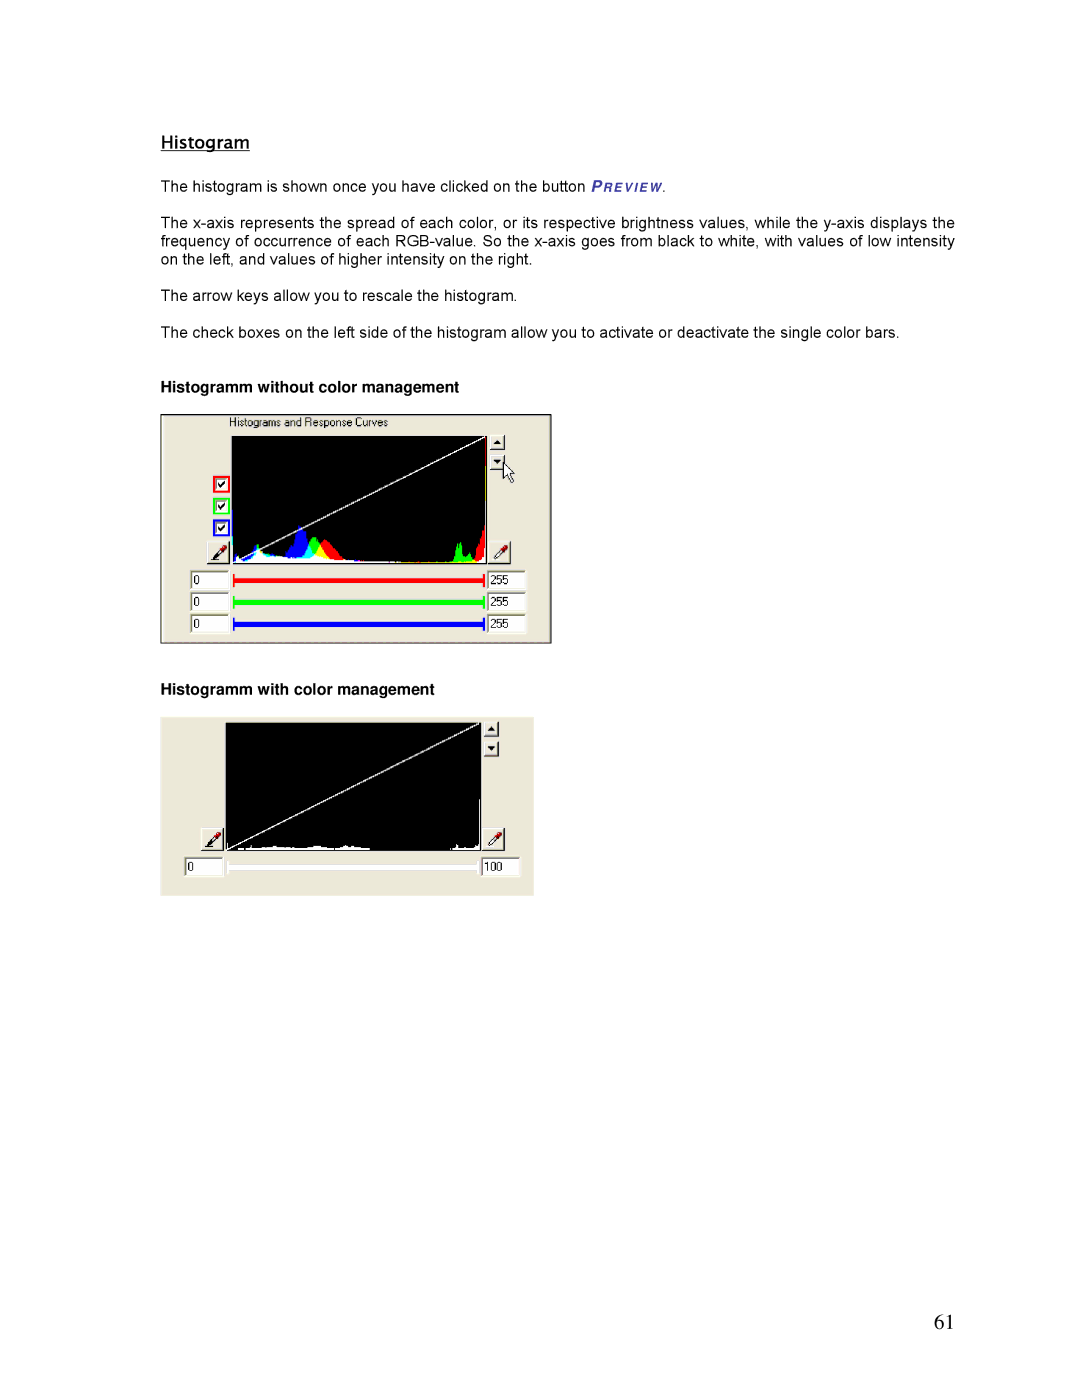
Histogramm without color management

Histogramm with color management

61

Page 61
Image 61
HP SCP Software for s manual Histogram