Advanced
∫Histogram
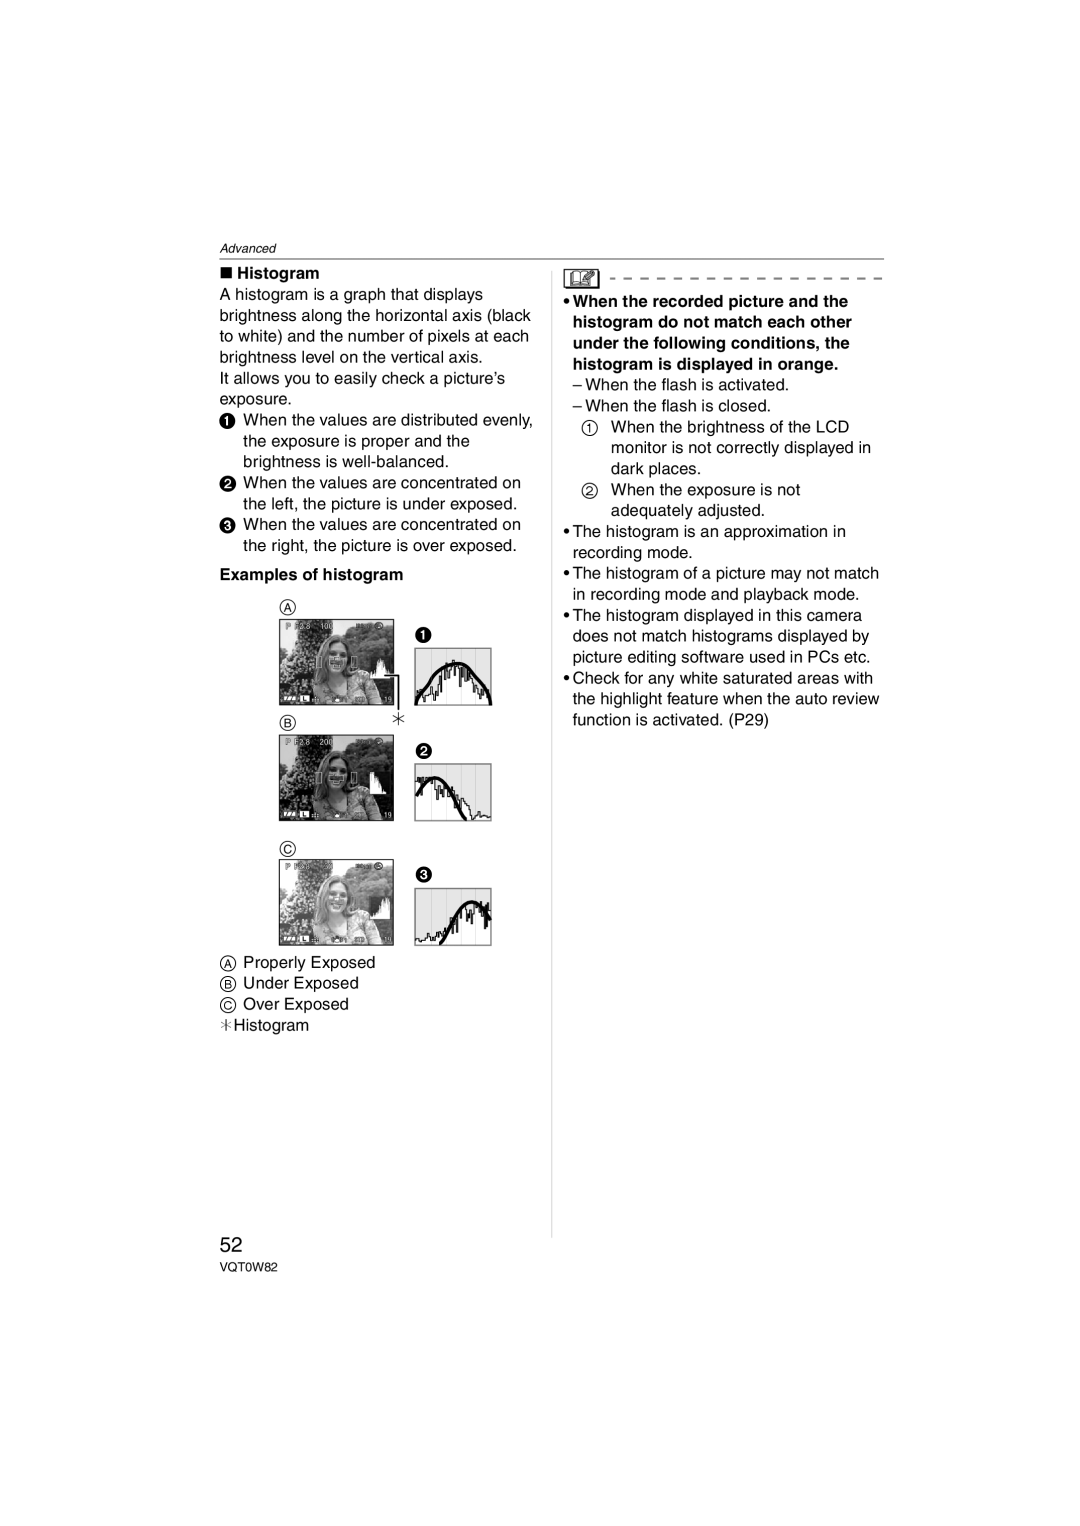
A histogram is a graph that displays brightness along the horizontal axis (black to white) and the number of pixels at each brightness level on the vertical axis.
It allows you to easily check a picture’s exposure.
1When the values are distributed evenly, the exposure is proper and the brightness is
2When the values are concentrated on the left, the picture is under exposed.
3When the values are concentrated on the right, the picture is over exposed.
Examples of histogram
A
P F2.8 100 | ISO100 | 12 |
|
|
STD 19
B
P F2.8 200 | ISO100 | 2 |
|
|
STD 19
C
P F2.8 50 | ISO100 | 32 |
|
|
STD 19
AProperly Exposed B Under Exposed C Over Exposed ¢Histogram
52
•When the recorded picture and the histogram do not match each other under the following conditions, the histogram is displayed in orange.
–When the flash is activated.
–When the flash is closed.
1 When the brightness of the LCD monitor is not correctly displayed in dark places.
2When the exposure is not adequately adjusted.
•The histogram is an approximation in recording mode.
•The histogram of a picture may not match in recording mode and playback mode.
•The histogram displayed in this camera does not match histograms displayed by picture editing software used in PCs etc.
•Check for any white saturated areas with the highlight feature when the auto review function is activated. (P29)
VQT0W82
