| Page Status | Page Up |
|
| |
Displayed Event Number |
|
|
Histogram Area |
| Page Down |
|
| |
| Total Event Count |
|
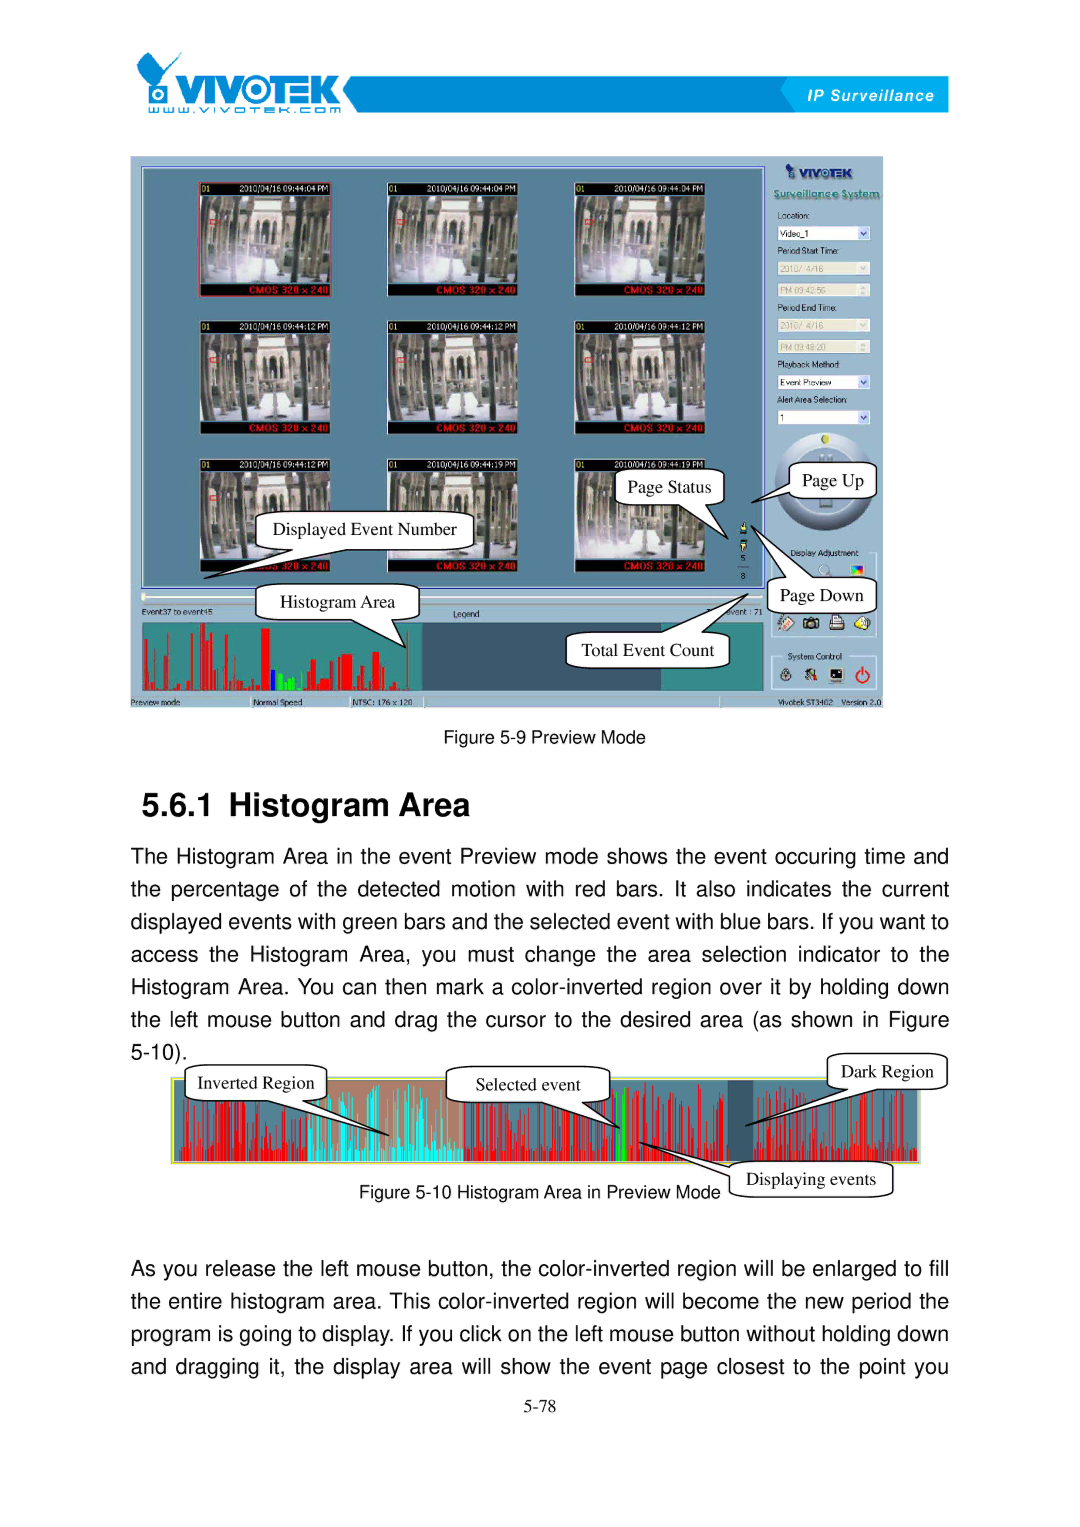
Figure 5-9 Preview Mode
5.6.1 Histogram59BArea
The Histogram Area in the event Preview mode shows the event occuring time and the percentage of the detected motion with red bars. It also indicates the current displayed events with green bars and the selected event with blue bars. If you want to access the Histogram Area, you must change the area selection indicator to the Histogram Area. You can then mark a
Inverted Region | Selected event | Dark Region |
|
Figure 5-10 Histogram Area in Preview Mode
Displaying events
As you release the left mouse button, the
