V i e w i n g a n d C u s t o m i z i n g L o o k s
When verification is complete a window similar to the following appears.
3)Click OK.
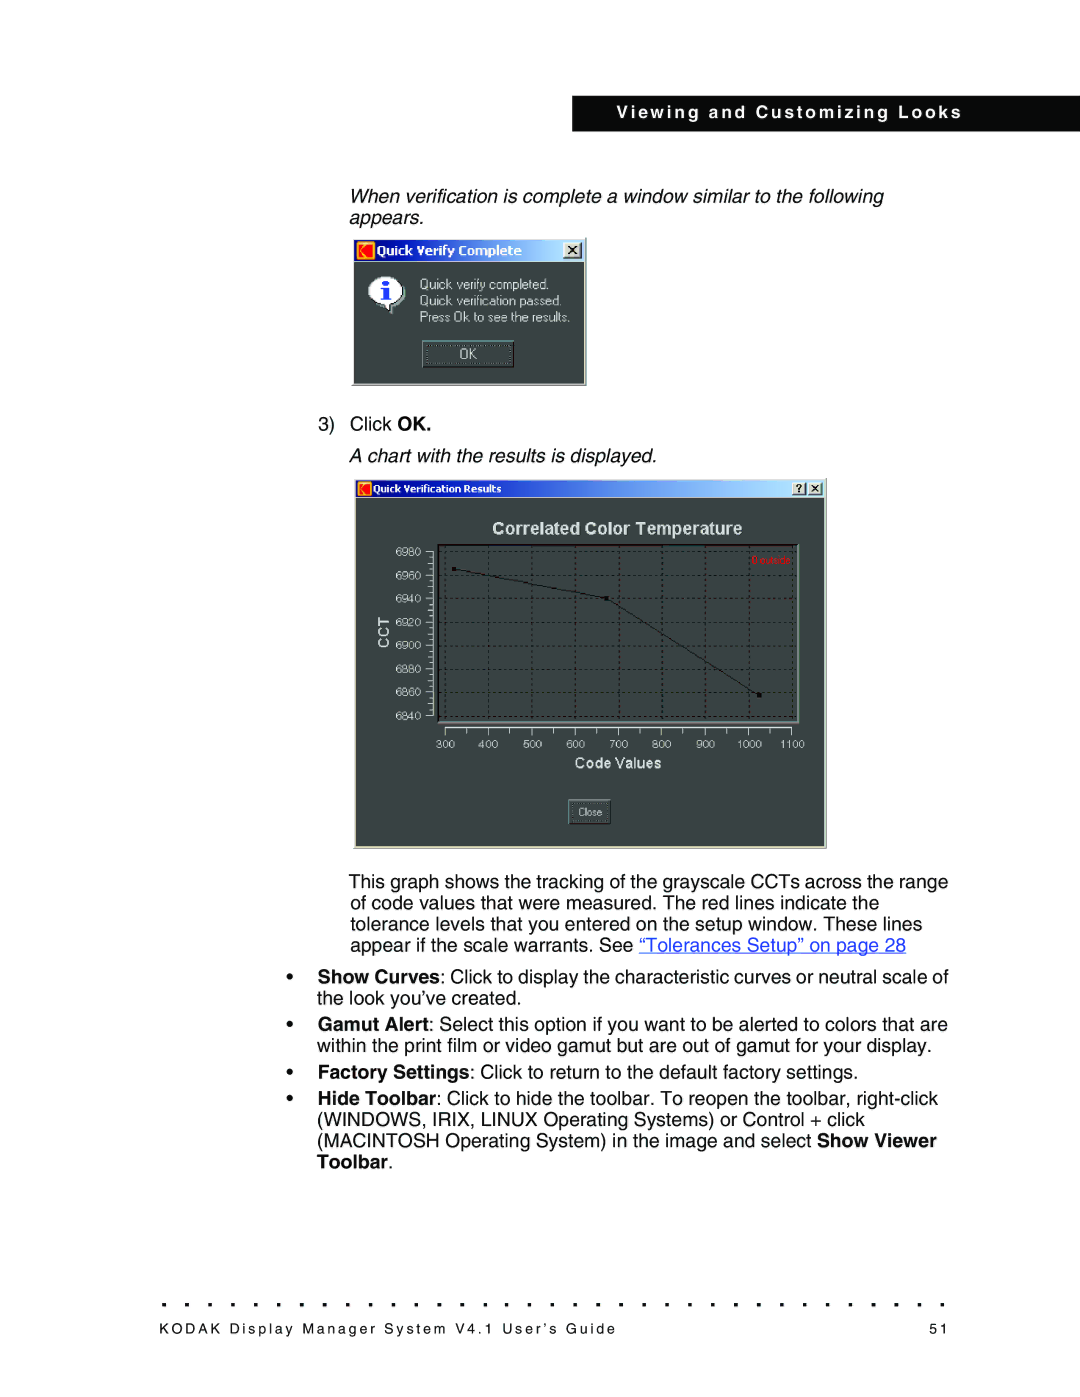
A chart with the results is displayed.
This graph shows the tracking of the grayscale CCTs across the range of code values that were measured. The red lines indicate the tolerance levels that you entered on the setup window. These lines appear if the scale warrants. See “Tolerances Setup” on page 28
•Show Curves: Click to display the characteristic curves or neutral scale of the look you’ve created.
•Gamut Alert: Select this option if you want to be alerted to colors that are within the print film or video gamut but are out of gamut for your display.
•Factory Settings: Click to return to the default factory settings.
•Hide Toolbar: Click to hide the toolbar. To reopen the toolbar,
K O D A K D i s p l a y M a n a g e r S y s t e m V 4 . 1 U s e r ’ s G u i d e | 5 1 |
