Ve r i f y i n g
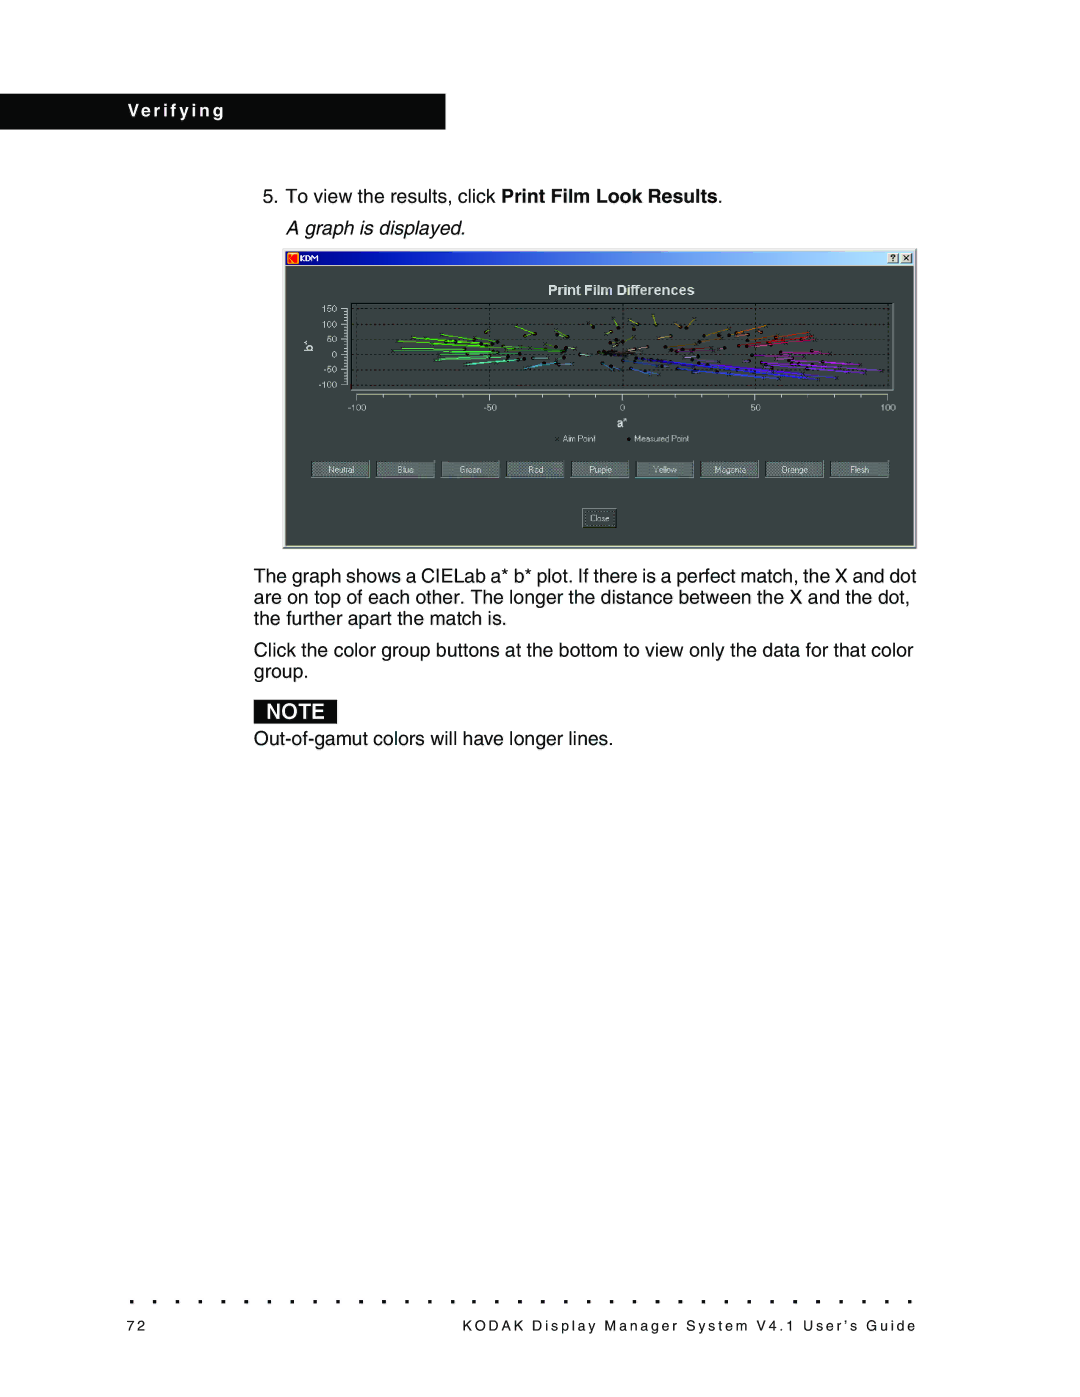
5.To view the results, click Print Film Look Results. A graph is displayed.
The graph shows a CIELab a* b* plot. If there is a perfect match, the X and dot are on top of each other. The longer the distance between the X and the dot, the further apart the match is.
Click the color group buttons at the bottom to view only the data for that color group.
NOTE
7 2 | K O D A K D i s p l a y M a n a g e r S y s t e m V 4 . 1 U s e r ’ s G u i d e |
