Omega Vehicle Security OM-550 manual Status BAR

Models: OM-550

1 84
Download 84 pages 19.9 Kb
Page 73
Image 73

2.8.1 STATUS BAR

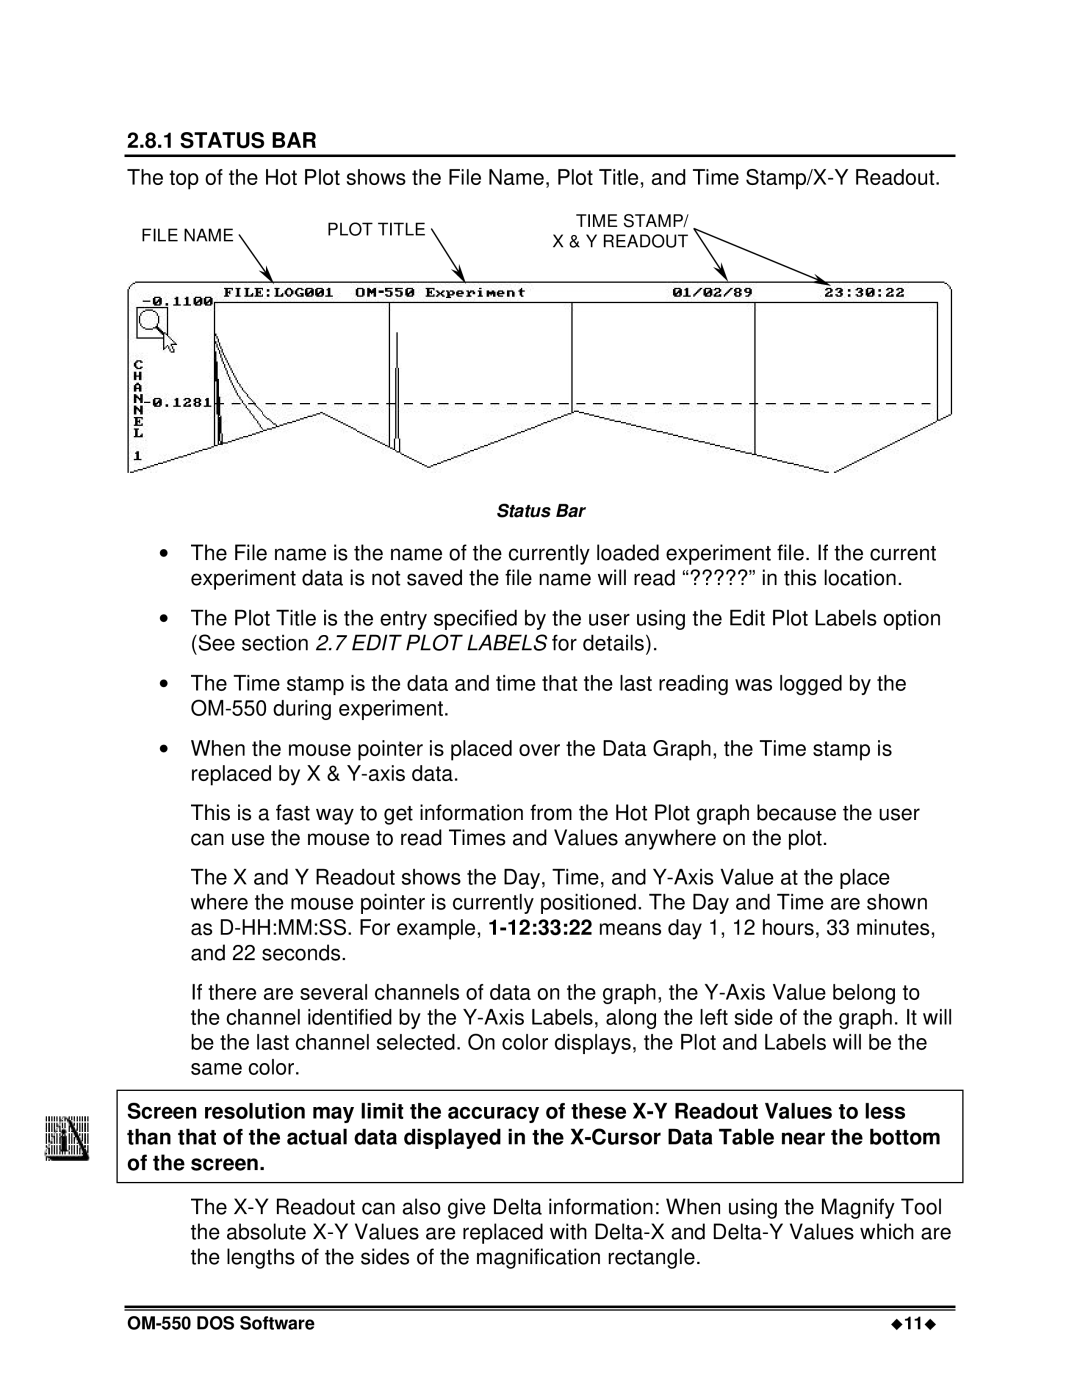
The top of the Hot Plot shows the File Name, Plot Title, and Time Stamp/X-Y Readout.

FILE NAME

PLOT TITLE

TIME STAMP/

X & Y READOUT


Status Bar

The File name is the name of the currently loaded experiment file. If the current experiment data is not saved the file name will read “?????” in this location.

The Plot Title is the entry specified by the user using the Edit Plot Labels option (See section 2.7 EDIT PLOT LABELS for details).

The Time stamp is the data and time that the last reading was logged by the OM-550 during experiment.

When the mouse pointer is placed over the Data Graph, the Time stamp is replaced by X & Y-axis data.

This is a fast way to get information from the Hot Plot graph because the user can use the mouse to read Times and Values anywhere on the plot.

The X and Y Readout shows the Day, Time, and Y-Axis Value at the place where the mouse pointer is currently positioned. The Day and Time are shown as D-HH:MM:SS. For example, 1-12:33:22means day 1, 12 hours, 33 minutes, and 22 seconds.

If there are several channels of data on the graph, the Y-Axis Value belong to the channel identified by the Y-Axis Labels, along the left side of the graph. It will be the last channel selected. On color displays, the Plot and Labels will be the same color.

Screen resolution may limit the accuracy of these X-Y Readout Values to less than that of the actual data displayed in the X-Cursor Data Table near the bottom of the screen.

The X-Y Readout can also give Delta information: When using the Magnify Tool the absolute X-Y Values are replaced with Delta-X and Delta-Y Values which are the lengths of the sides of the magnification rectangle.

OM-550 DOS Software

u11u

Page 73
Image 73
Omega Vehicle Security OM-550 manual Status BAR