Hotwire 8784 TDM Sdsl Termination Unit
Copyright 2001 Paradyne Corporation All rights reserved
Important Safety Instructions
United States EMI Notice
Contents
Monitoring the Unit
Initial Startup and Configuration
February
Security
Testing
Messages and Troubleshooting
IP Addressing T
Technical Specifications Glossary Index
Configuration Options
Connector Pin Assignments
Standards ComplianceT for Snmp Traps
Document Purpose and Intended Audience
About This Guide
Document Summary
Product-Related Documents
Document Number Document Title
About the Hotwire Termination Unit
TDM Sdsl Overview
Hotwire 8784 Termination Unit Features
Customer Premises CP
Network Configuration
CO Site
Snmp Trap Support
Snmp Management Capabilities
Management Information Base MIB Support
Network
User Interface Access
Using the Asynchronous Terminal Interface
Management Serial Port Settings
Login
Logging In to the Hotwire Dslam
Initiating an ATI Session
Select
Main Menu
Menu Hierarchy
Snmp
Function
Main Menu→ Configuration → Current Configuration → Network
Screen Work Areas
Keys
Keyboard Keys
Navigating the Screens
Press
Function Keys
For the screen Function Select Press Enter to
Switching Between Screen Work Areas
Example
Ending an ATI Session
Exiting From the Dslam Session
Using the Asynchronous Terminal Interface February
Initial Startup and Configuration
Overview
Main Menu→ Control→ Change Identity
Entering Identity Information
Identity
Main Menu→ Configuration Load Configuration From
Configuring the Unit
Load Configuration from
Configuration EDIT/DISPLAY
Current and Default Factory Configurations
If you select Then
Main Menu→ Configuration → Configuration Loader
Configuration Loader
Select To Access To Configure
Configuration Loader
Completed successfully
Saving Configuration Changes
Save Configuration
Download Code
Downloading Firmware
Main Menu→ Control → Download Code
DSL1
Apply Download
Main Menu→ Configuration→ Current Configuration → Network
AutoRate Feature
Disabling AutoRate
Main Menu→ Control→ Reset AutoRate
Restoring Access to the User Interface
Resetting AutoRate
Select Configuration→ DSL Cards → Reset Slot
Resetting the Unit
Main Menu→ Control→ Reset Device
Monitoring the Unit
What to Monitor
Main Menu→ Status→ System and Test Status
Viewing System and Test Status
System and Test Status Health and Status SELF-TEST Results
Health and Status Messages
Yyyyyyyy
Monitoring the Unit
Test Status Messages
Self-Test Results Messages
Test Status Messages Meaning
Network Error Statistics
Viewing Network Error Statistics
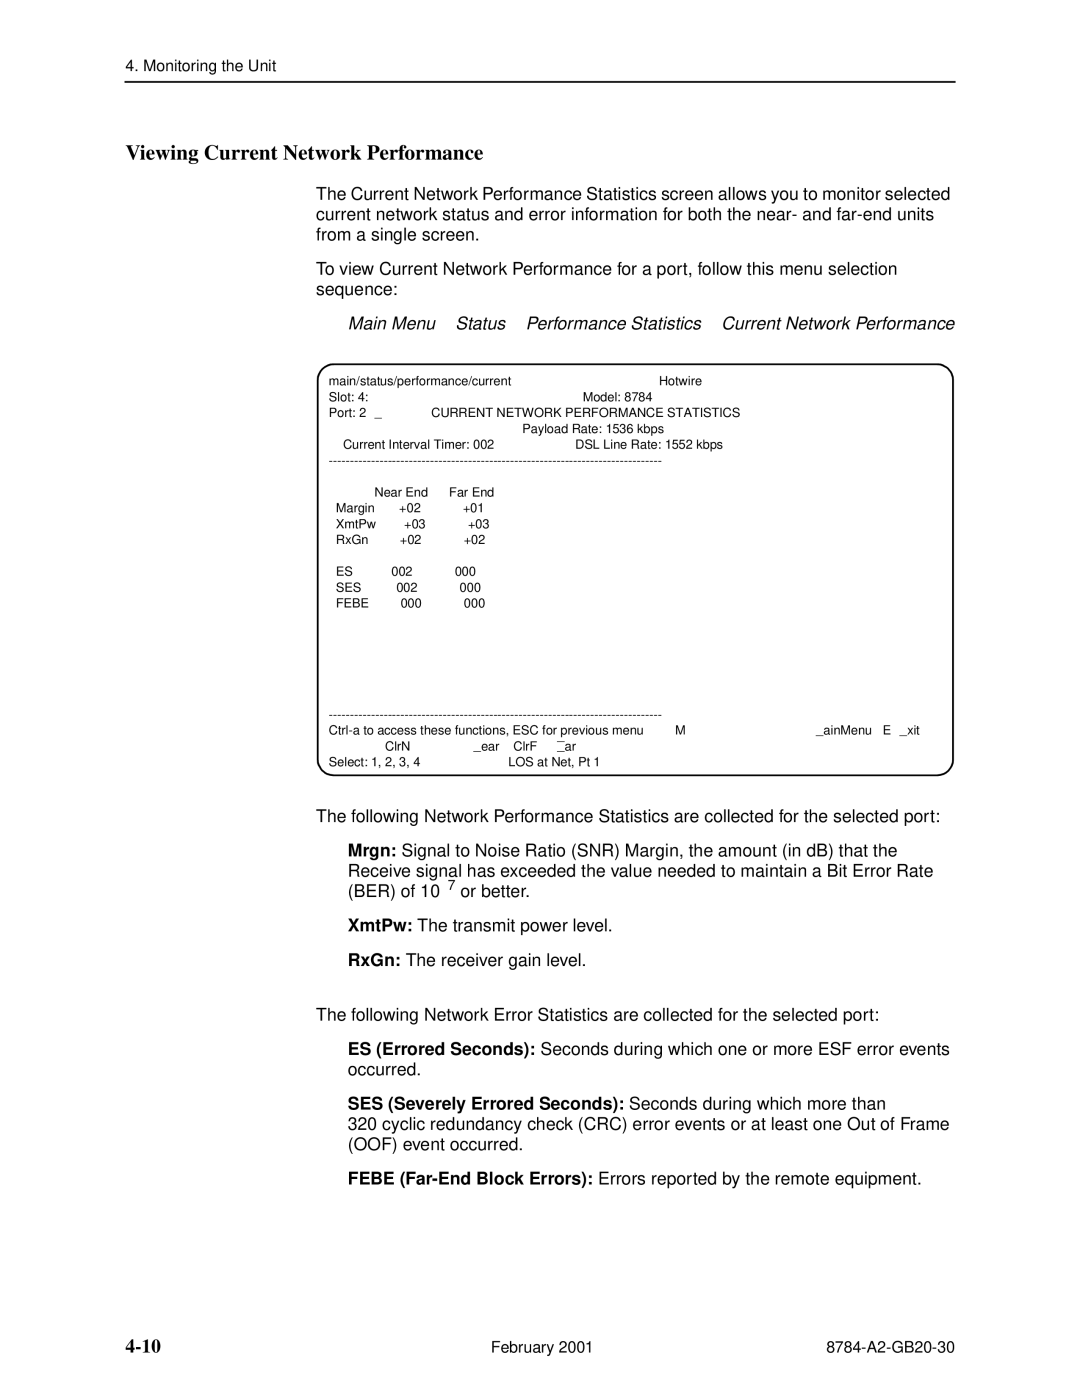
Performance Statistics
SES Severely Errored Seconds Seconds during which more than
Field Contains
Viewing Network Performance Statistics
This Field Contains
SES
Viewing Current Network Performance
Current Network Performance Statistics
Febe
Main Menu→ Status→ Performance Statistics→ DSX-1 Statistics
Viewing DSX-1 Performance Statistics
DSX-1 Performance Statistics
This Field Contains
General
Viewing LED Status
Display
DSL Loop
Type
Front Panel LEDs
LED is Indicating
Main Menu→ Test
Testing
Accessing the Test Menu
Test
Main Menu→ Test→ Network & DSX-1 Tests
Running Network Tests
Network & DSX-1 Tests
Line Loopback
Repeater Loopback
DTE Loopback
Remote Send Line Loopback
Send and Monitor
Main Menu→ Test→ Device Tests
Device Tests
Lamp Test
Device Tests
Configuration Options
Ending an Active Test
Telco-Initiated Payload Loopback
Telco-Initiated Tests
Telco-Initiated Line Loopback
Activation Line Payload Remote Line Deactivation Loopback
Telco-Initiated Remote Line Loopback
CAP LIU DSL DSX-1
Testing February
Messages and Troubleshooting
Snmp Traps Options
Configuring Snmp Traps
NMS
Device Messages
Device Messages 1 What Message Indicates What To Do
Device Messages 2 What Message Indicates What To Do
Troubleshooting
Troubleshooting Symptom Possible Cause Solutions
Messages and Troubleshooting February
ATI Access Levels
Security
Creating a Login
Administer Logins
Deleting a Login
On the Login Entry Screen, for Enter
Management Options, in Appendix A, Configuration Options
Controlling Snmp Access
Assigning Snmp Community Names and Access Types
Configuration Options, to
IP Addressing
Configurations Not Running IP Conservative Software
All Configurations
Selecting an IP Addressing Scheme
IP Addressing Example
Peer IP Address Assignments
Configuration Options
Configuration Changes in , Initial Startup and Configuration
Network Interface Options
Main Menu→ Configuration→ Current Configuration→ Network
Excessive Error Rate Threshold
Table A-1. Network Interface Options 1
AutoRate
DSL Line Rate Possible Settings 400, 528, 784, 1040
Table A-1. Network Interface Options 2
Circuit Identifier
DSX-1 Interface Options
Main Menu→ Configuration→ Current Configuration → DSX-1
DSX-1 Interface Options
ESF
Line Framing
Table A-2. DSX-1 Interface Options 1
Port Status
Line Coding
Send All Ones on DSX-1 Failure
Table A-2. DSX-1 Interface Options 2
Send AIS on Network Failure
Primary Clock Source
Table A-3. Copy Ports Options
Main Menu→ Configuration→ Current Configuration→ Copy Ports
Copy Ports Options
From Port n
System Options
Main Menu→ Configuration→ Current Configuration→ System
System Options
LTU
Table A-4. System Options
Management and Communication Menu
Telnet Session Options
Inactivity Timeout
Telnet Login Required
Session Access Level
Table A-5. Telnet Session Options 1
Table A-5. Telnet Session Options 2
Main Menu→ Configuration→ Current Configuration→
General Snmp Management Options
Disconnect Time Minutes
Table A-6. General Snmp Management Options
Name 1 Access
Name 2 Access
Snmp Management
Snmp NMS Security Options
Snmp NMS Security Options
Table A-7. Snmp NMS Security Options
Access Level
NMS IP Validation
Snmp Trap Options
Number of Trap Managers
Table A-8. Snmp Trap Options 1
Snmp Traps
NMS n Destination
Enterprise Specific Traps
Link Traps Possible Settings Disable, Up, Down, Both
Table A-8. Snmp Trap Options 2
Link Traps Interfaces
Snmp Traps
AuthenticationFailure
Standards Compliance for Snmp Traps
WarmStart
LinkUp and linkDown
LinkUp/DownT Variable-Bindings
Enterprise-Specific Traps
DSL Network IfIndex RFC
Front Panel 50-pin DTE Connector Pinouts
Connector Pin Assignments
50-Pin Connector DSX-1 Port Pinout Function
Connector Pin Assignments February
Technical Specifications
Specifications Criteria
Technical Specifications February
Bridged tap
Glossary
511
COM port
Ethernet
Factory defaults
EIA-530-A
Frame
704
Reset
703
IP address
RS-449
Yellow Alarm
Router
Telnet
Index
IN-1
IN-2
IN-3
IN-4
IN-5
IN-6