14. Standard web server
14. 10. “Altivar Chart” page
Number of Modbus TCP connections used | 1 |
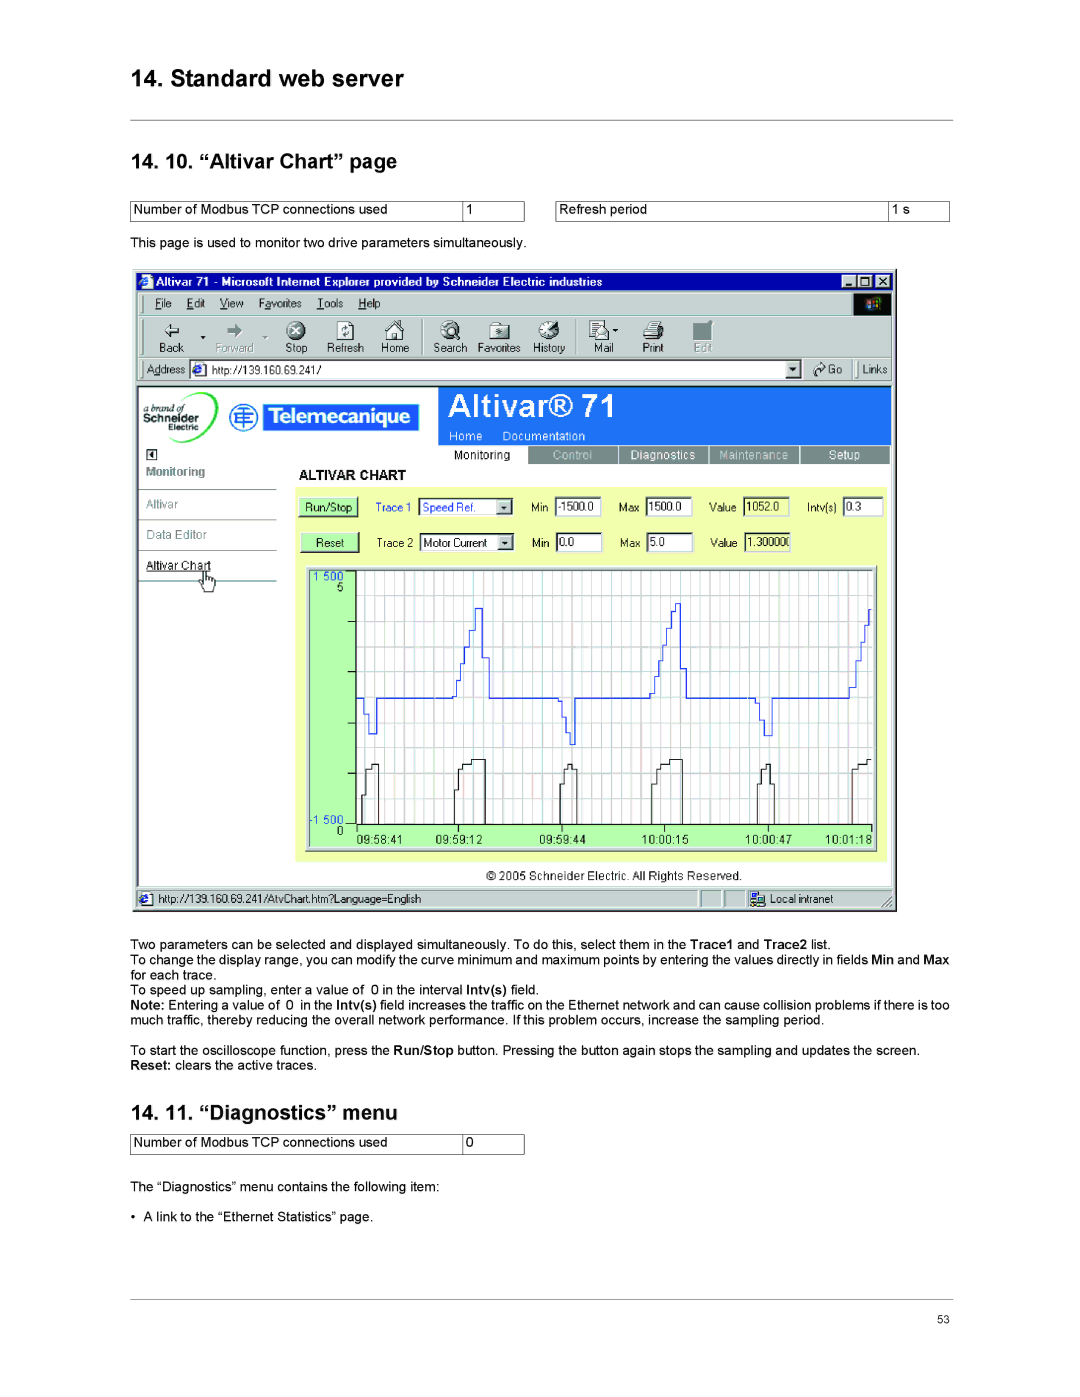
This page is used to monitor two drive parameters simultaneously.
Refresh period
1 s
Two parameters can be selected and displayed simultaneously. To do this, select them in the Trace1 and Trace2 list.
To change the display range, you can modify the curve minimum and maximum points by entering the values directly in fields Min and Max for each trace.
To speed up sampling, enter a value of 0 in the interval Intv(s) field.
Note: Entering a value of 0 in the Intv(s) field increases the traffic on the Ethernet network and can cause collision problems if there is too much traffic, thereby reducing the overall network performance. If this problem occurs, increase the sampling period.
To start the oscilloscope function, press the Run/Stop button. Pressing the button again stops the sampling and updates the screen. Reset: clears the active traces.
14. 11. “Diagnostics” menu
Number of Modbus TCP connections used
0
The “Diagnostics” menu contains the following item:
• A link to the “Ethernet Statistics” page.
53