paper. And it may be helpful to write the dot values (128, 64, 32, etc.) down the left side of each row. Then after you’ve filled in the “dots” that you want to print, it’s time to get out the old calculator again! Just as you did with download characters, add up the values of each column of dots; this makes up one byte.
In the program below, we’ve taken the logo graphics infor- mation and put it into BASIC DATA statements. The program itself is short and simple. The loop starting at line 100 reads the data statements into a string array variable called LOGO$. In line 170 we change the line spacing to 8/72 inch so that the lines of graphics data will connect vertically. The actual printing is done in the loop between lines 180 and 210; line 190 sends the graphics control code to
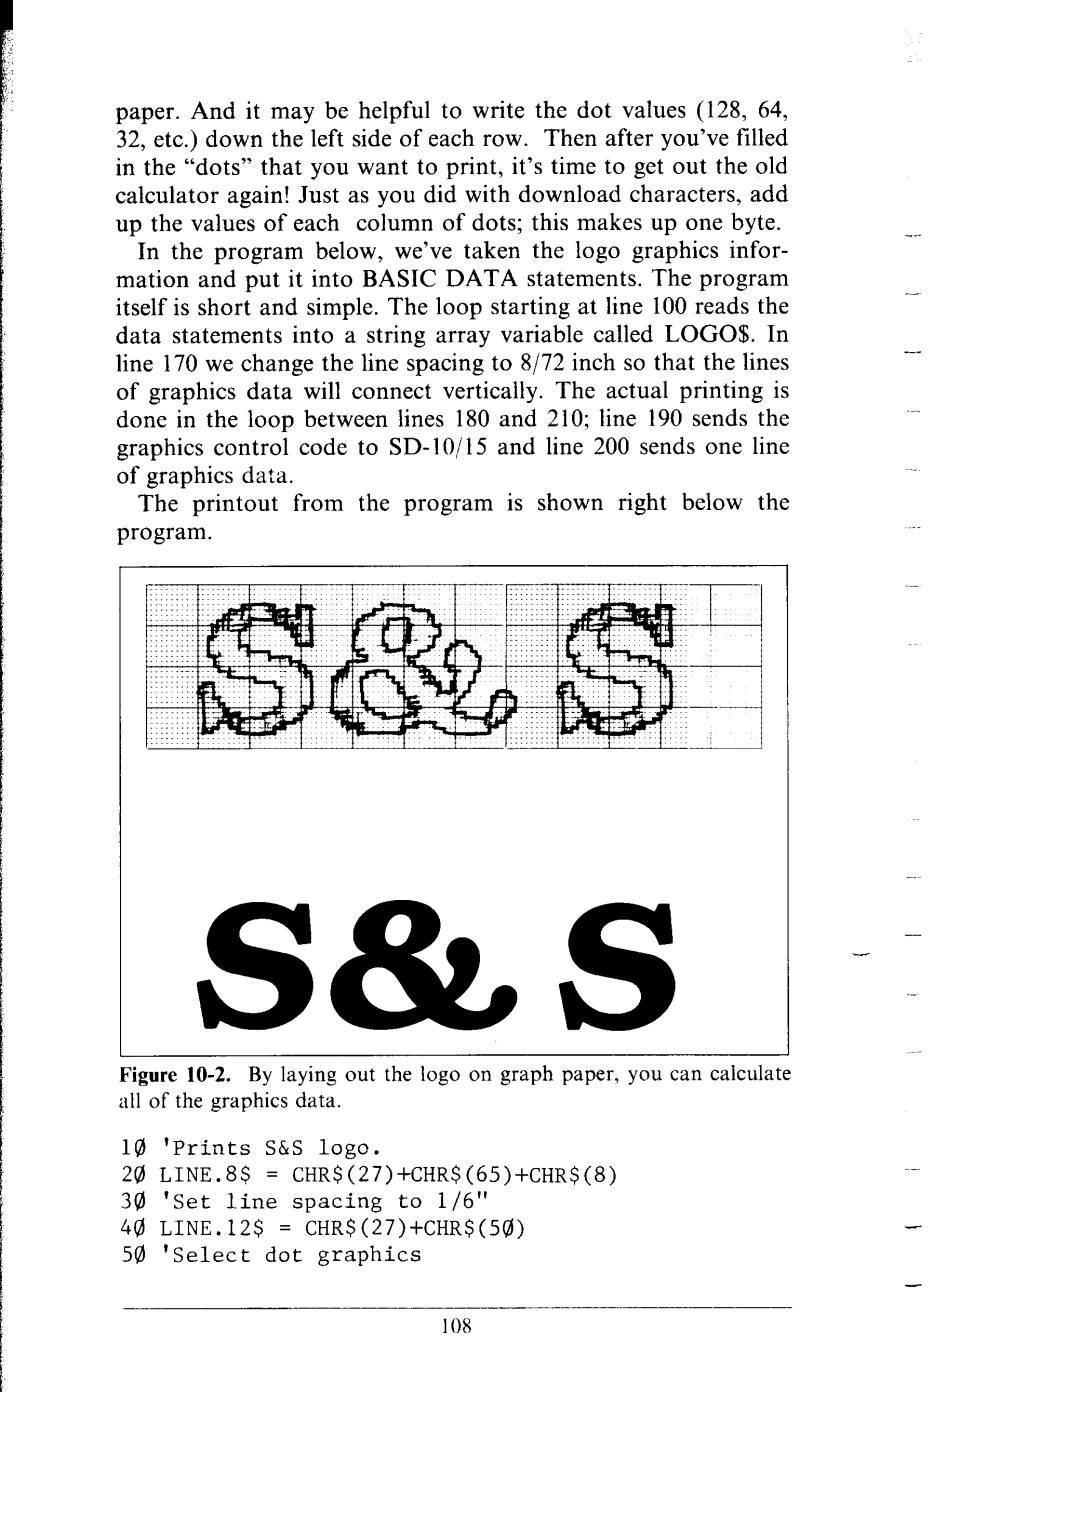
The printout from the program is shown right below the program.
S&S
Figure 10-2.By layingoutthelogoon graphpaper,youcancalculate allofthegraphicsdata.
10 ‘Prints S&S logo.
241LINE.8$ = CHR$(27>+CHR$(65)+CHR$(8) 30 ‘Set line spacing to l/6”
40 LINE.12$ = CHR$(27)+CHR$(5@)
50 ‘Select dot graphics
-
-